The user experience.
Everything users see and interact with — tile views, list views, drill-down navigation, indicators, filters, detail pages, and notes. All configured by administrators, no development required.
Your hierarchy.
Your tiles.
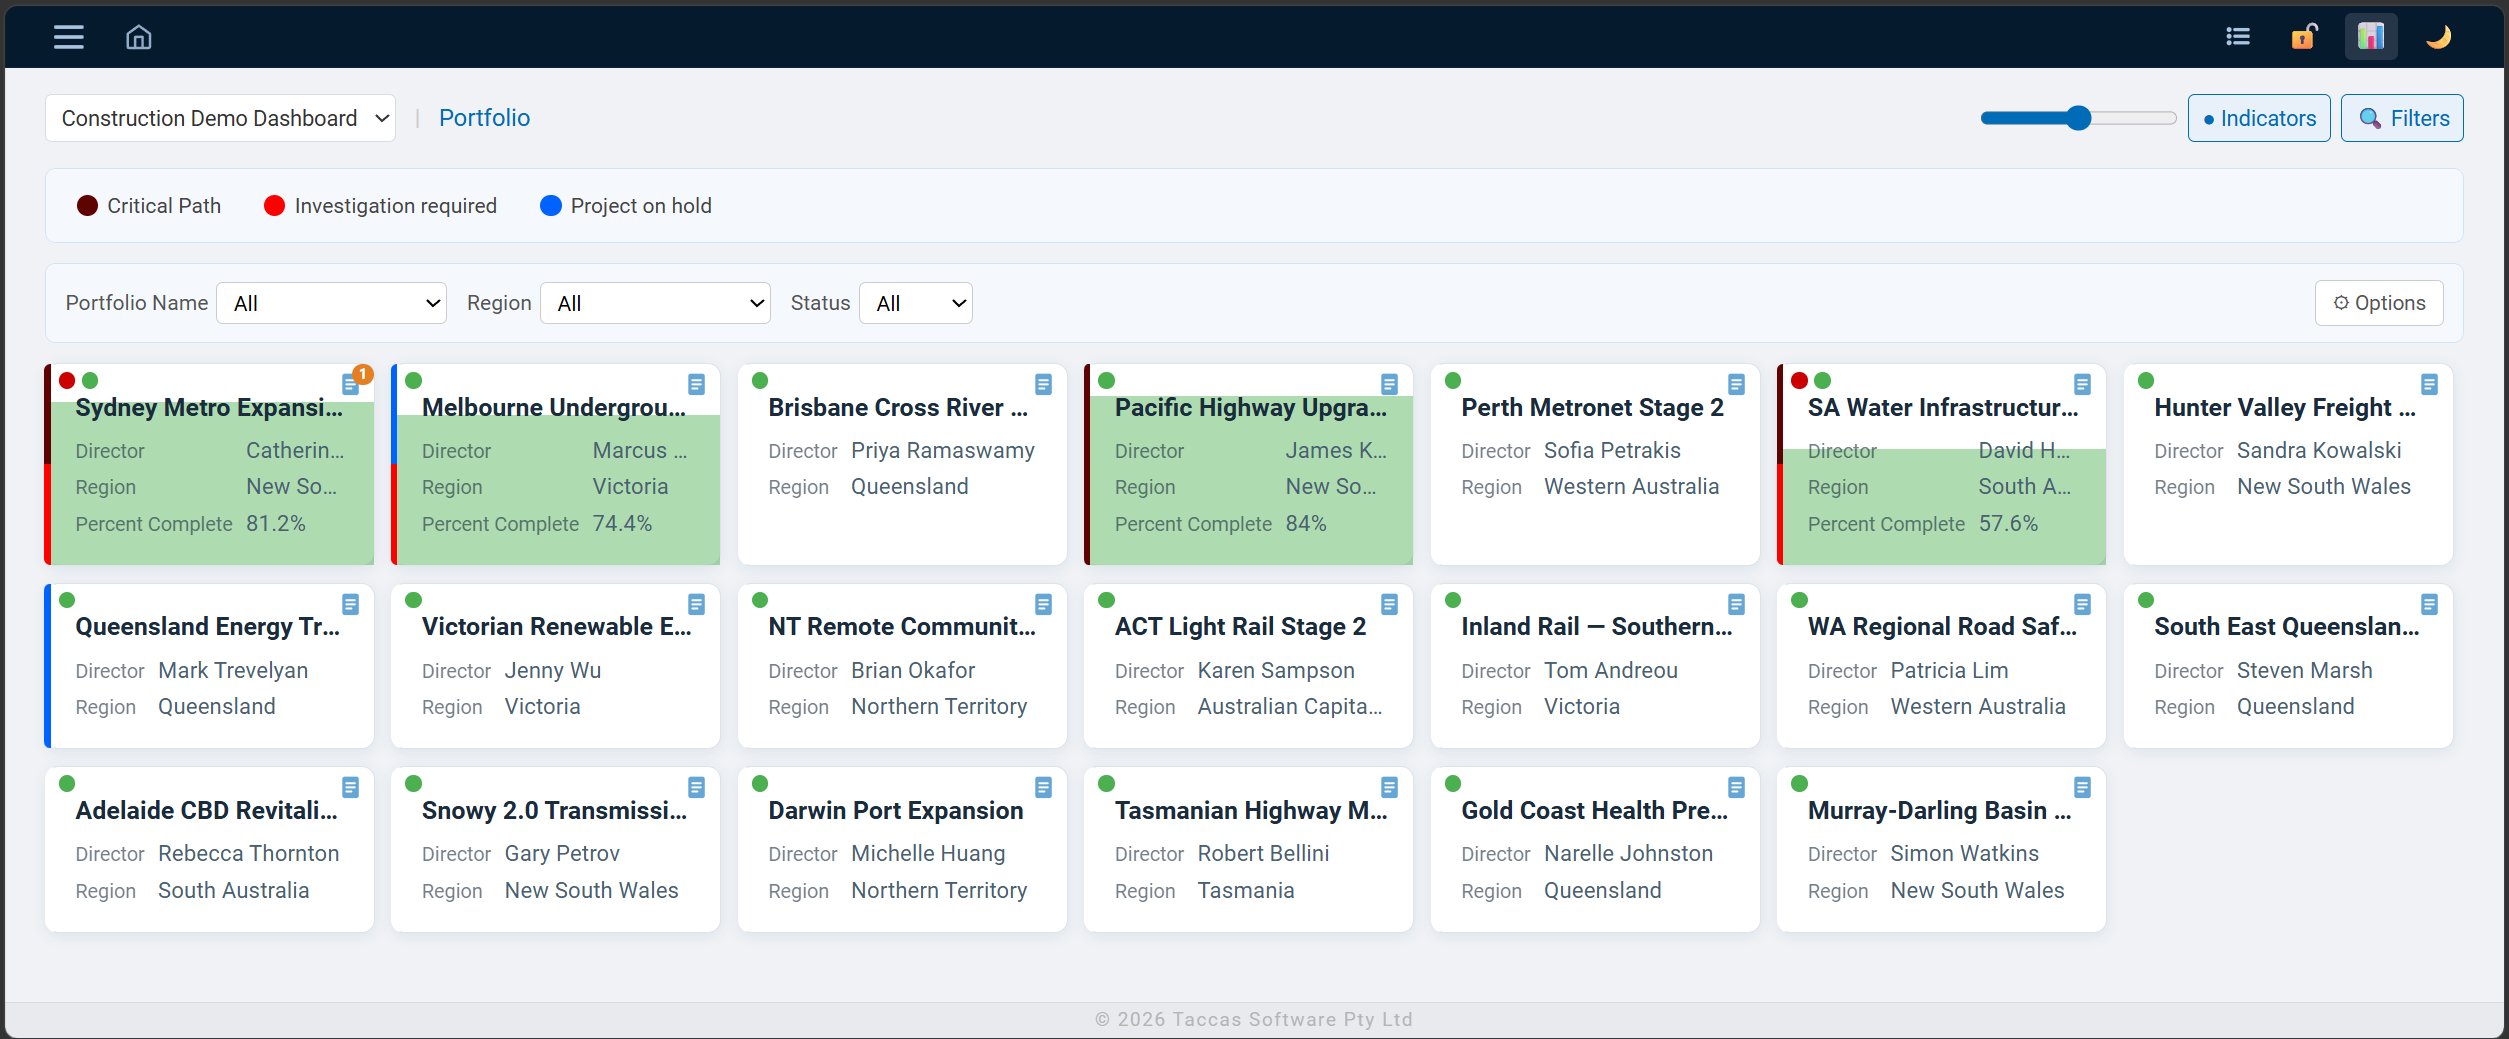
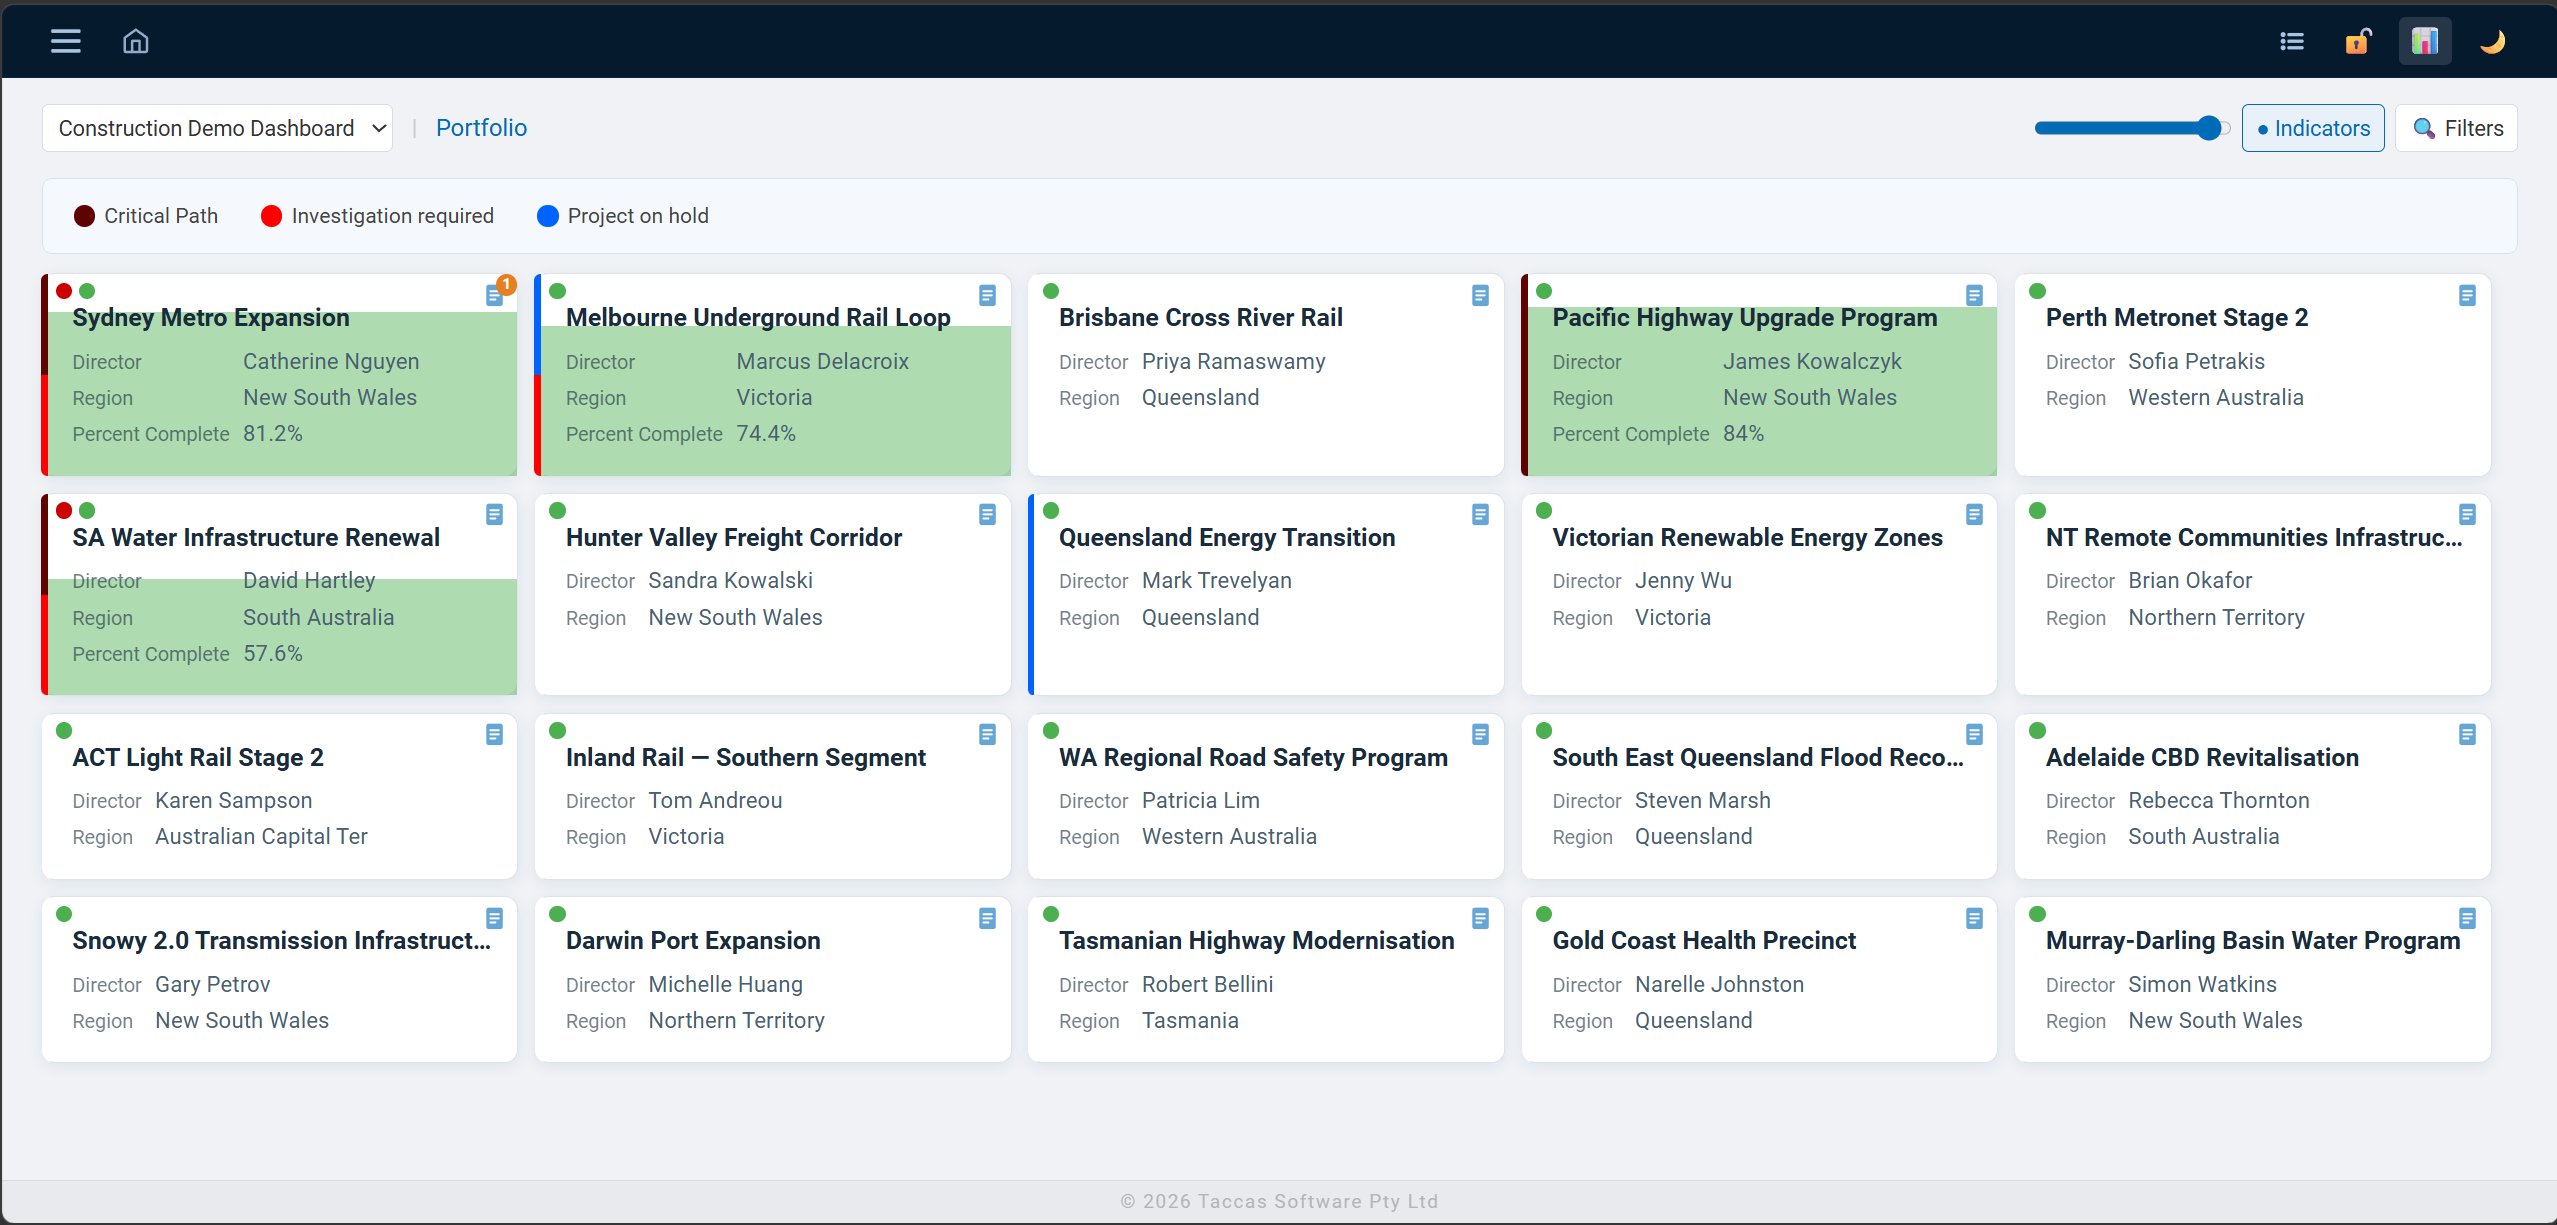
The default view presents each level of your data hierarchy as a grid of tiles. Each tile shows the fields your administrator has configured — and colour-coded indicator dots show status at a glance, without needing to open a record.
- Fields shown on tile are configured independently from tooltip and list view
- Colour indicator bars on the left edge — up to 4 per tile, proportional segments
- Tile size slider adjusts density across the whole dashboard in real time
- Breadcrumb trail always shows your current position in the hierarchy
- Template selector — switch between configured dashboards
- Dark and light theme toggle, persisted per user
Aggregates visualised
at a glance.
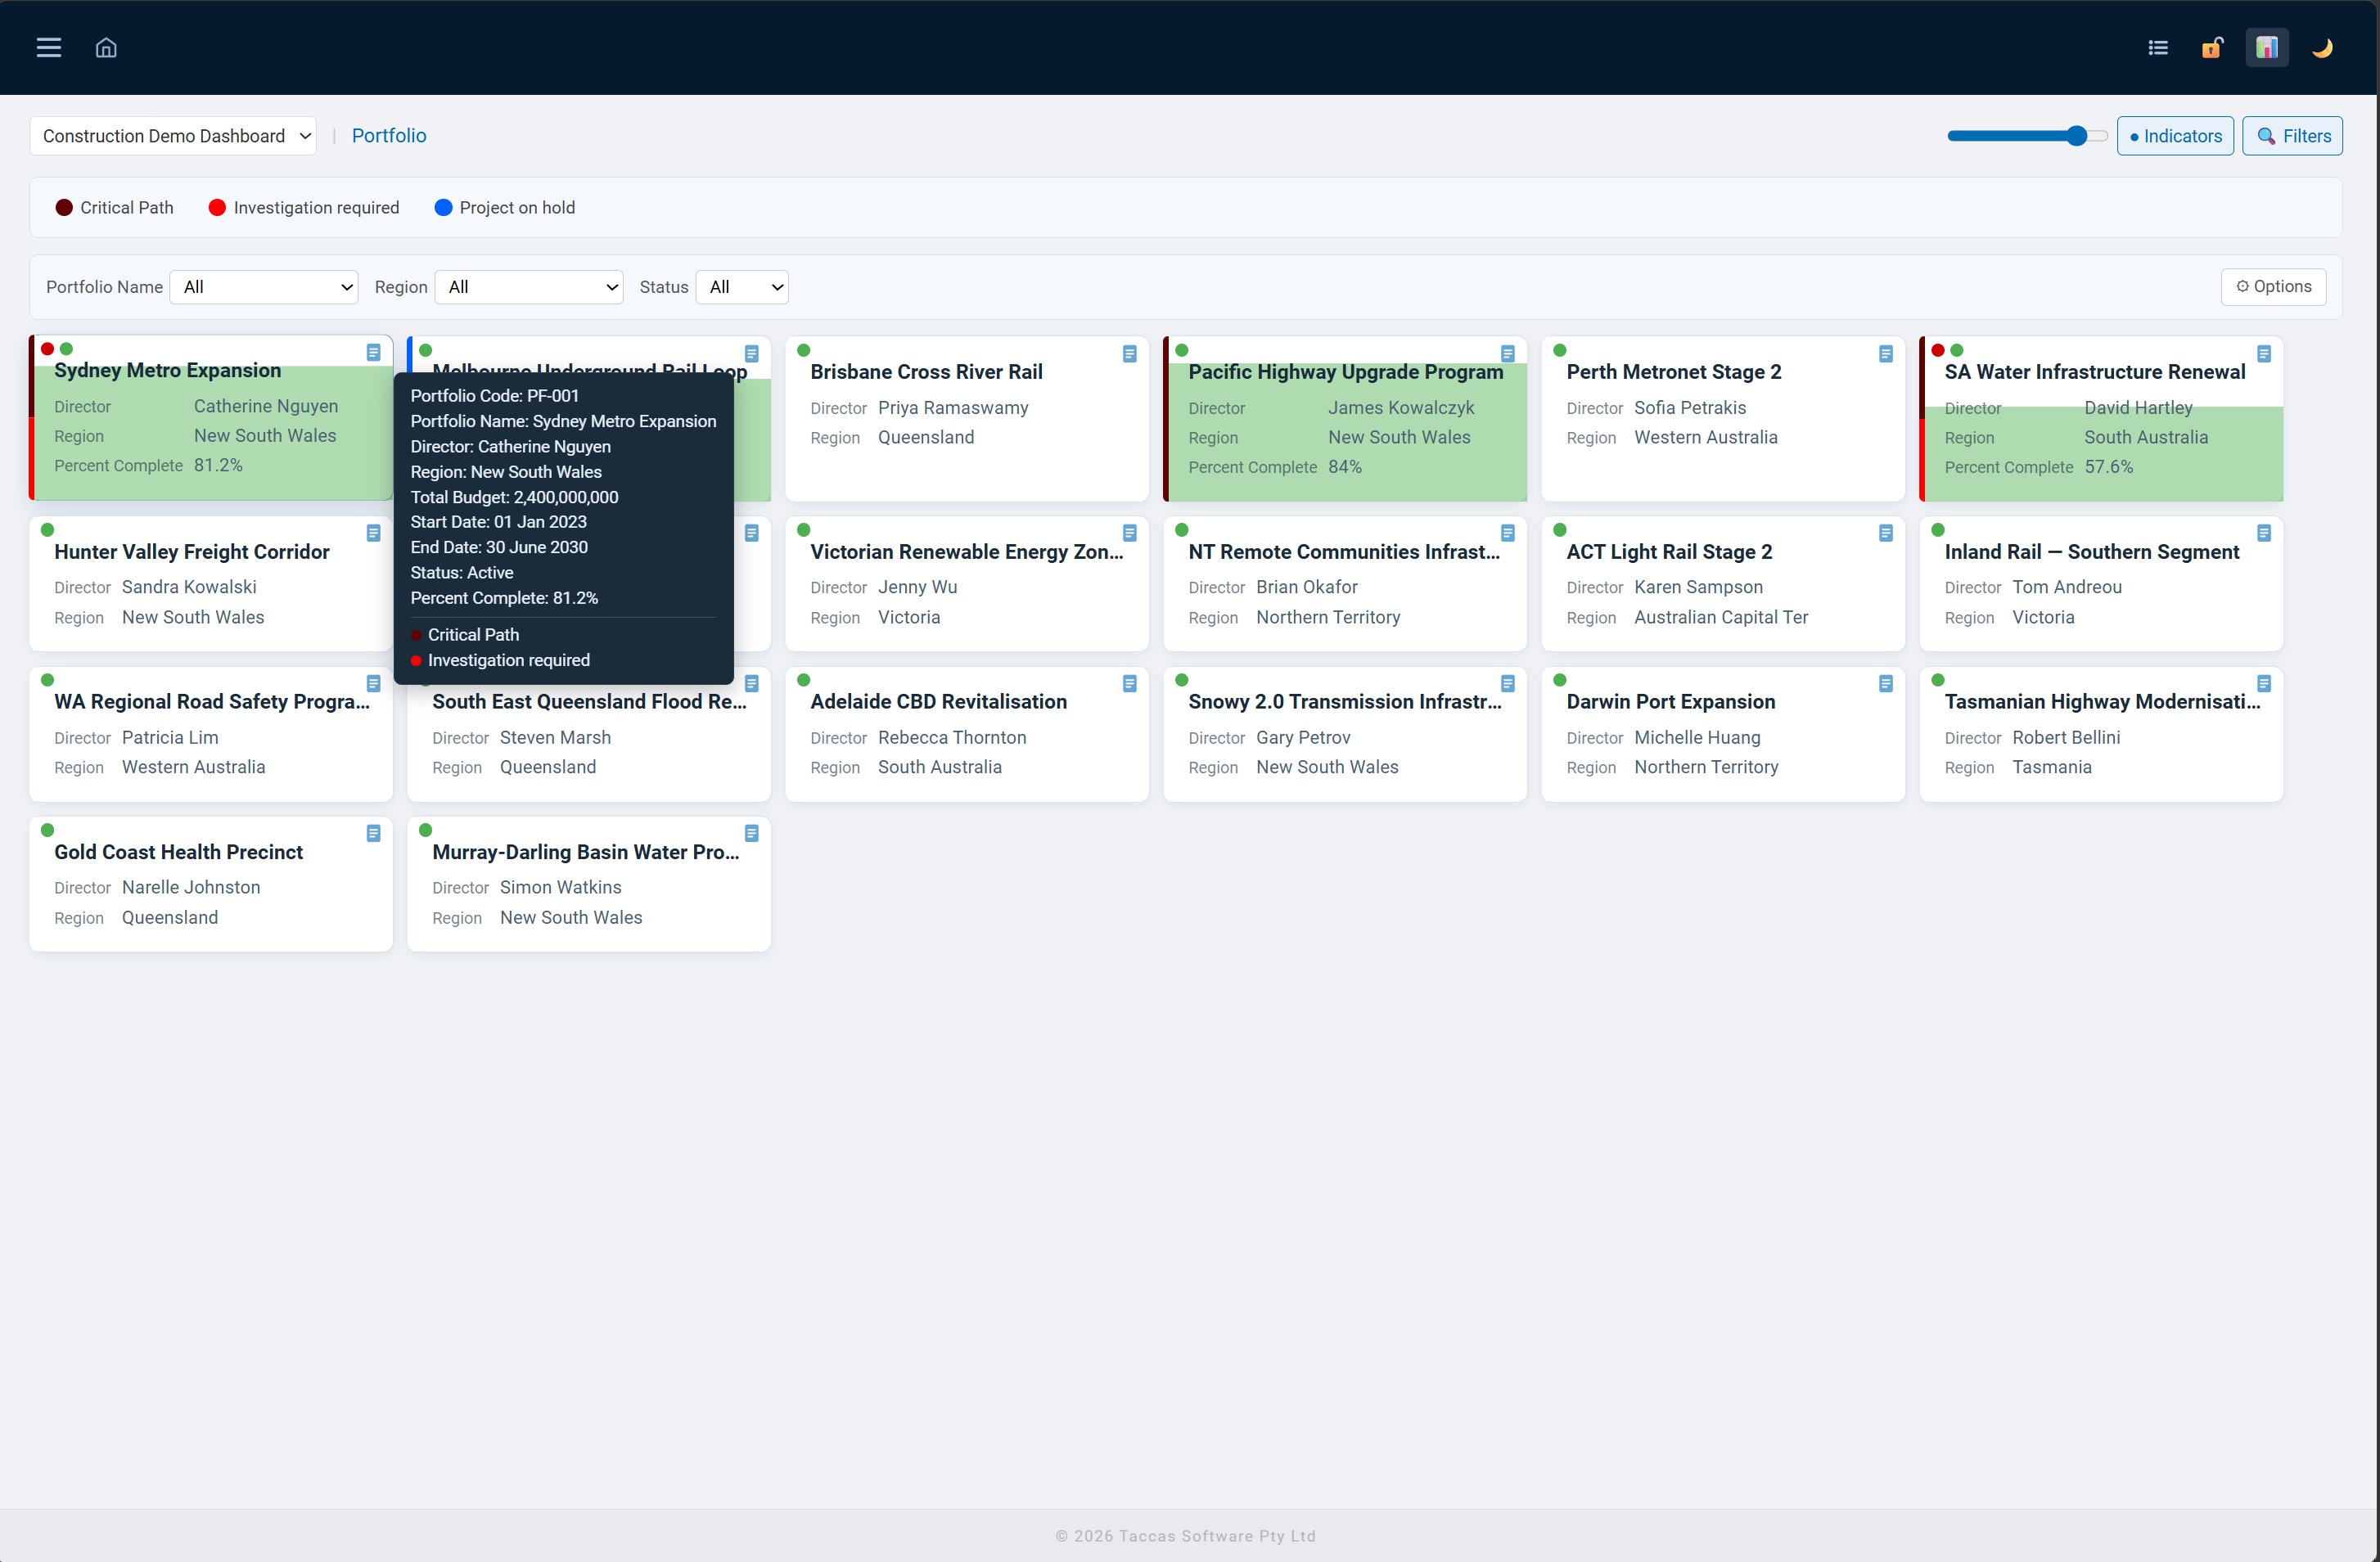
When aggregates are configured for a level, tiles can display a progress fill — a colour fill that rises from the bottom of the tile proportional to the aggregate value. In this view, the green fill represents the average Percent Complete rolled up from child records.
- Progress fill driven by any configured SUM or AVG aggregate
- Fill colour configured per aggregate by the administrator
- Toggle fill on or off per user preference
- Aggregate values also shown in tile footer and hover tooltip
- Multiple aggregates per level — each shown independently
More detail,
without leaving the page.
Hovering over any tile shows a tooltip with all configured tooltip fields, plus a list of active indicators with their colour dots. Gives users quick access to additional context without having to drill into the record.
- Tooltip fields configured separately from tile fields
- Active indicators listed with name and colour at the bottom of the tooltip
- Available in both tile view and list view
- Shows aggregate values when configured
When you need
the full picture.
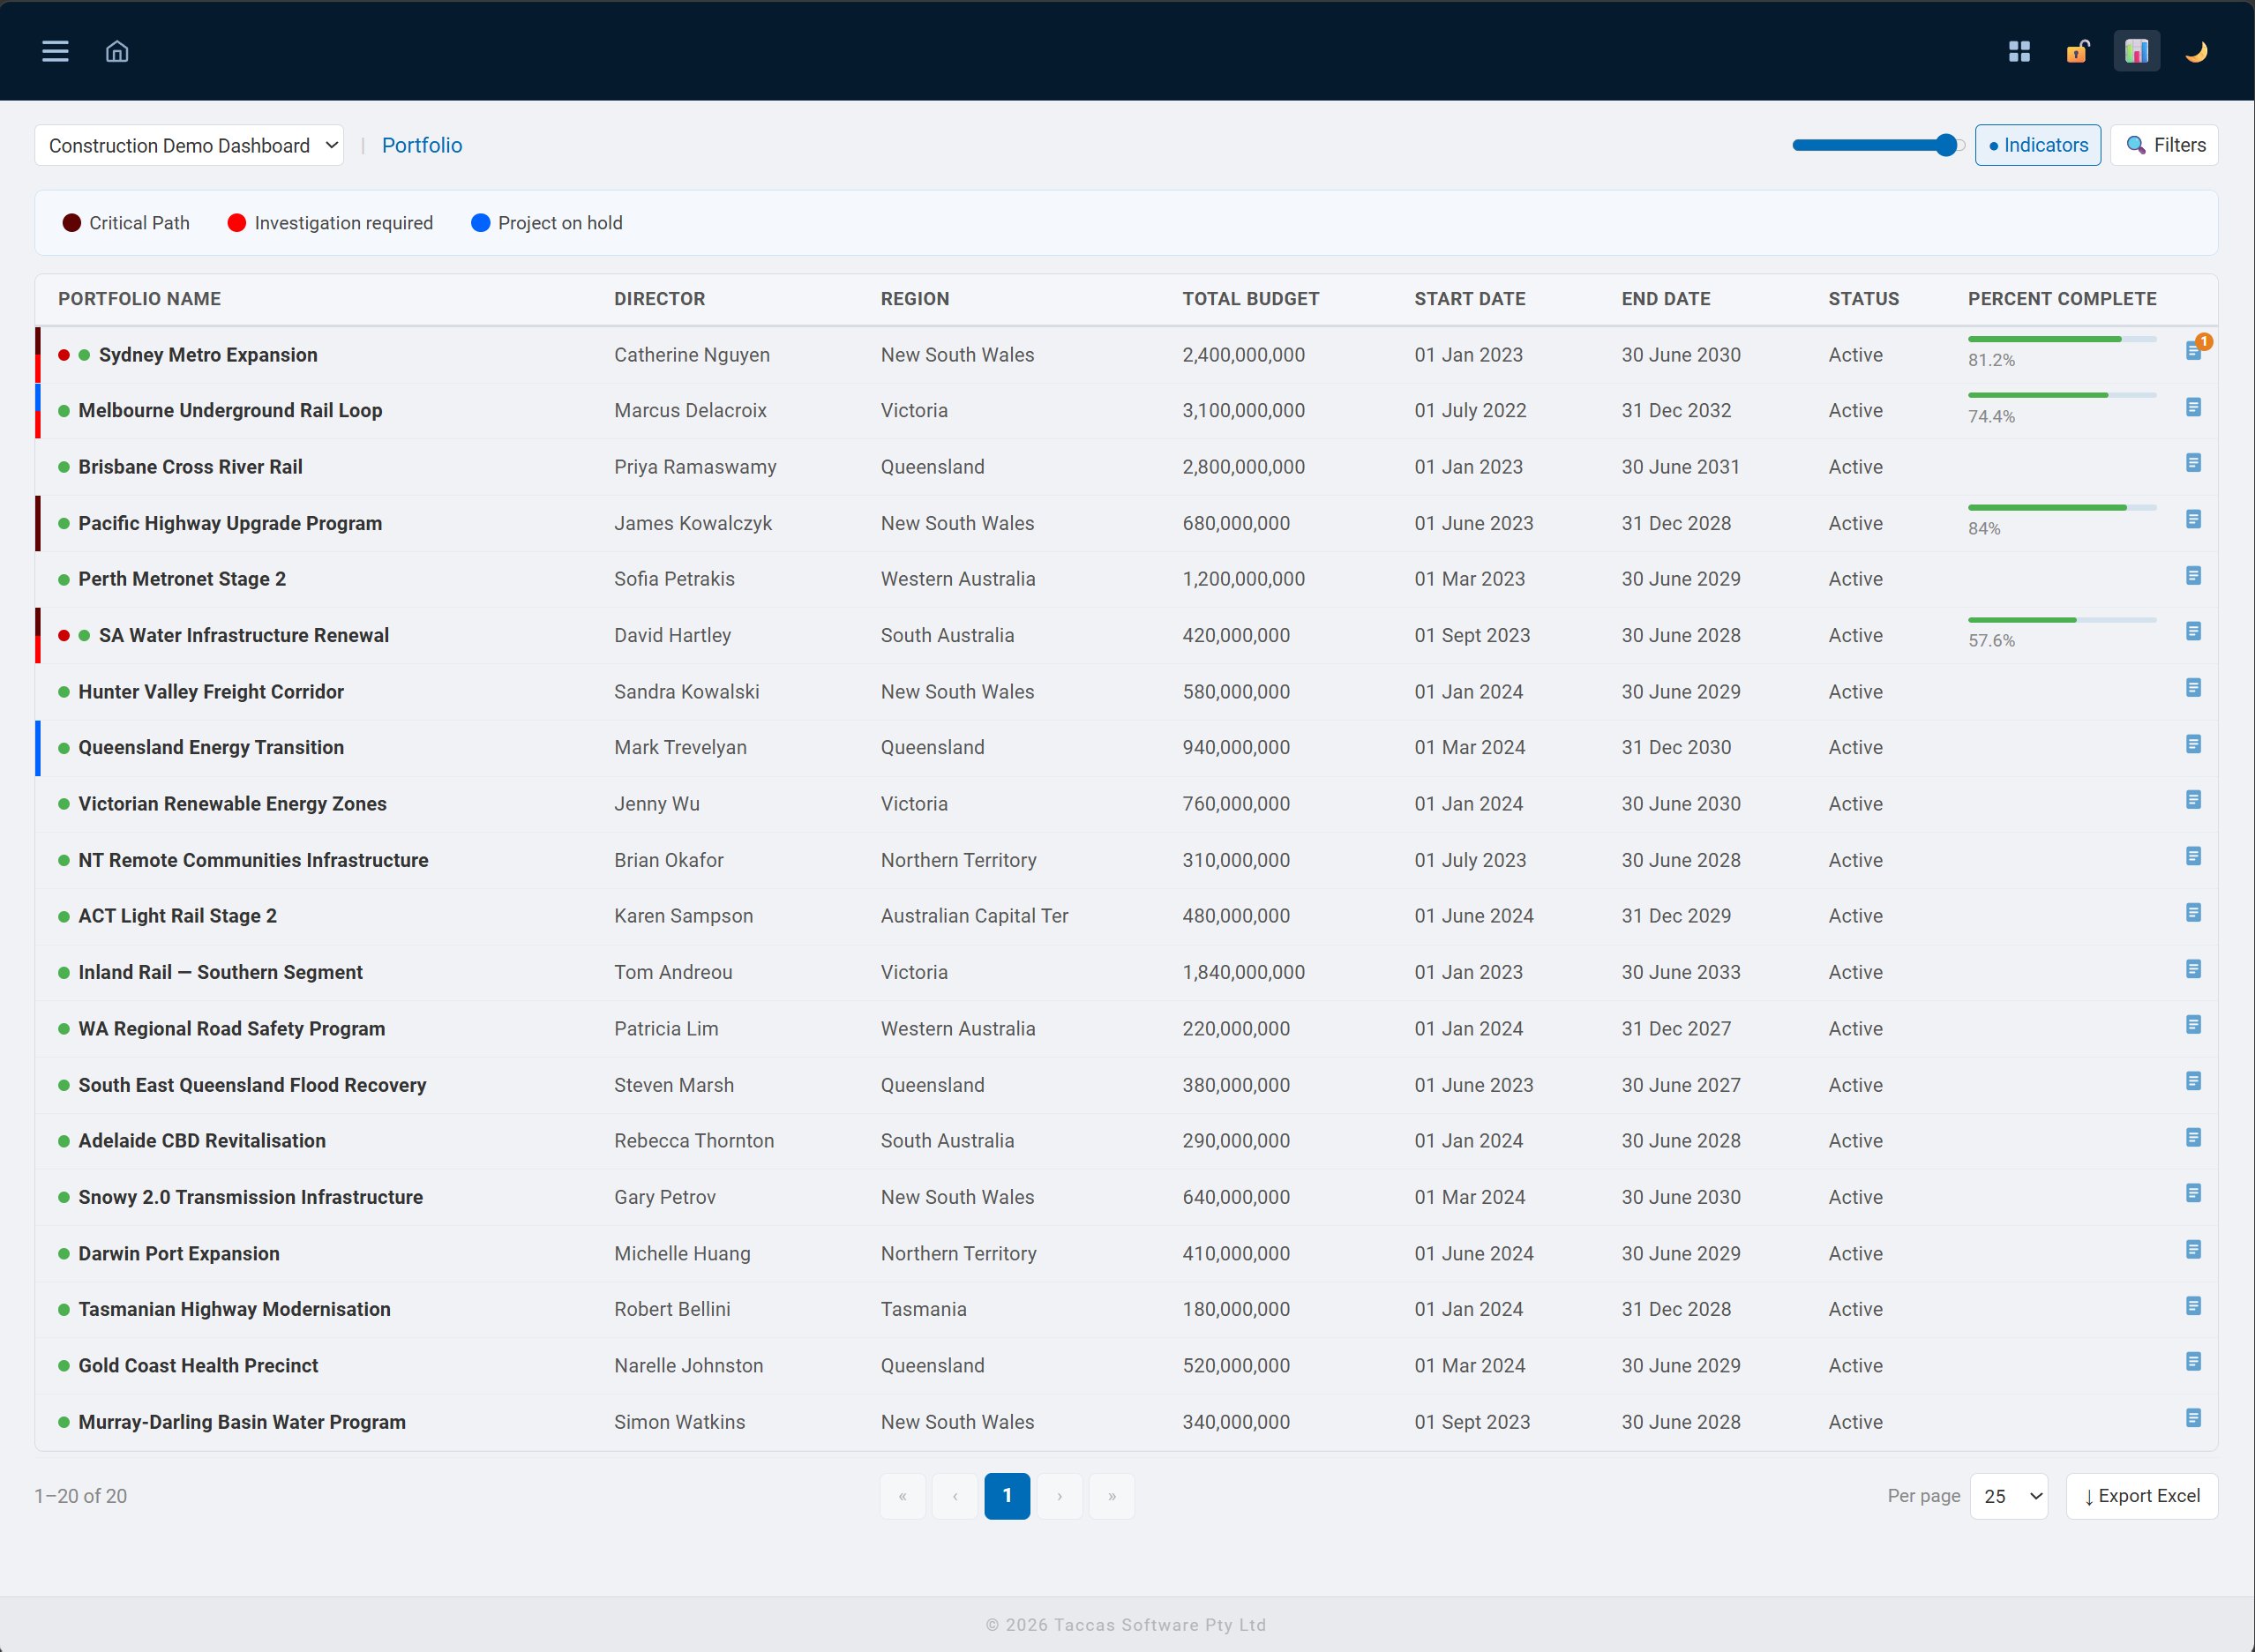
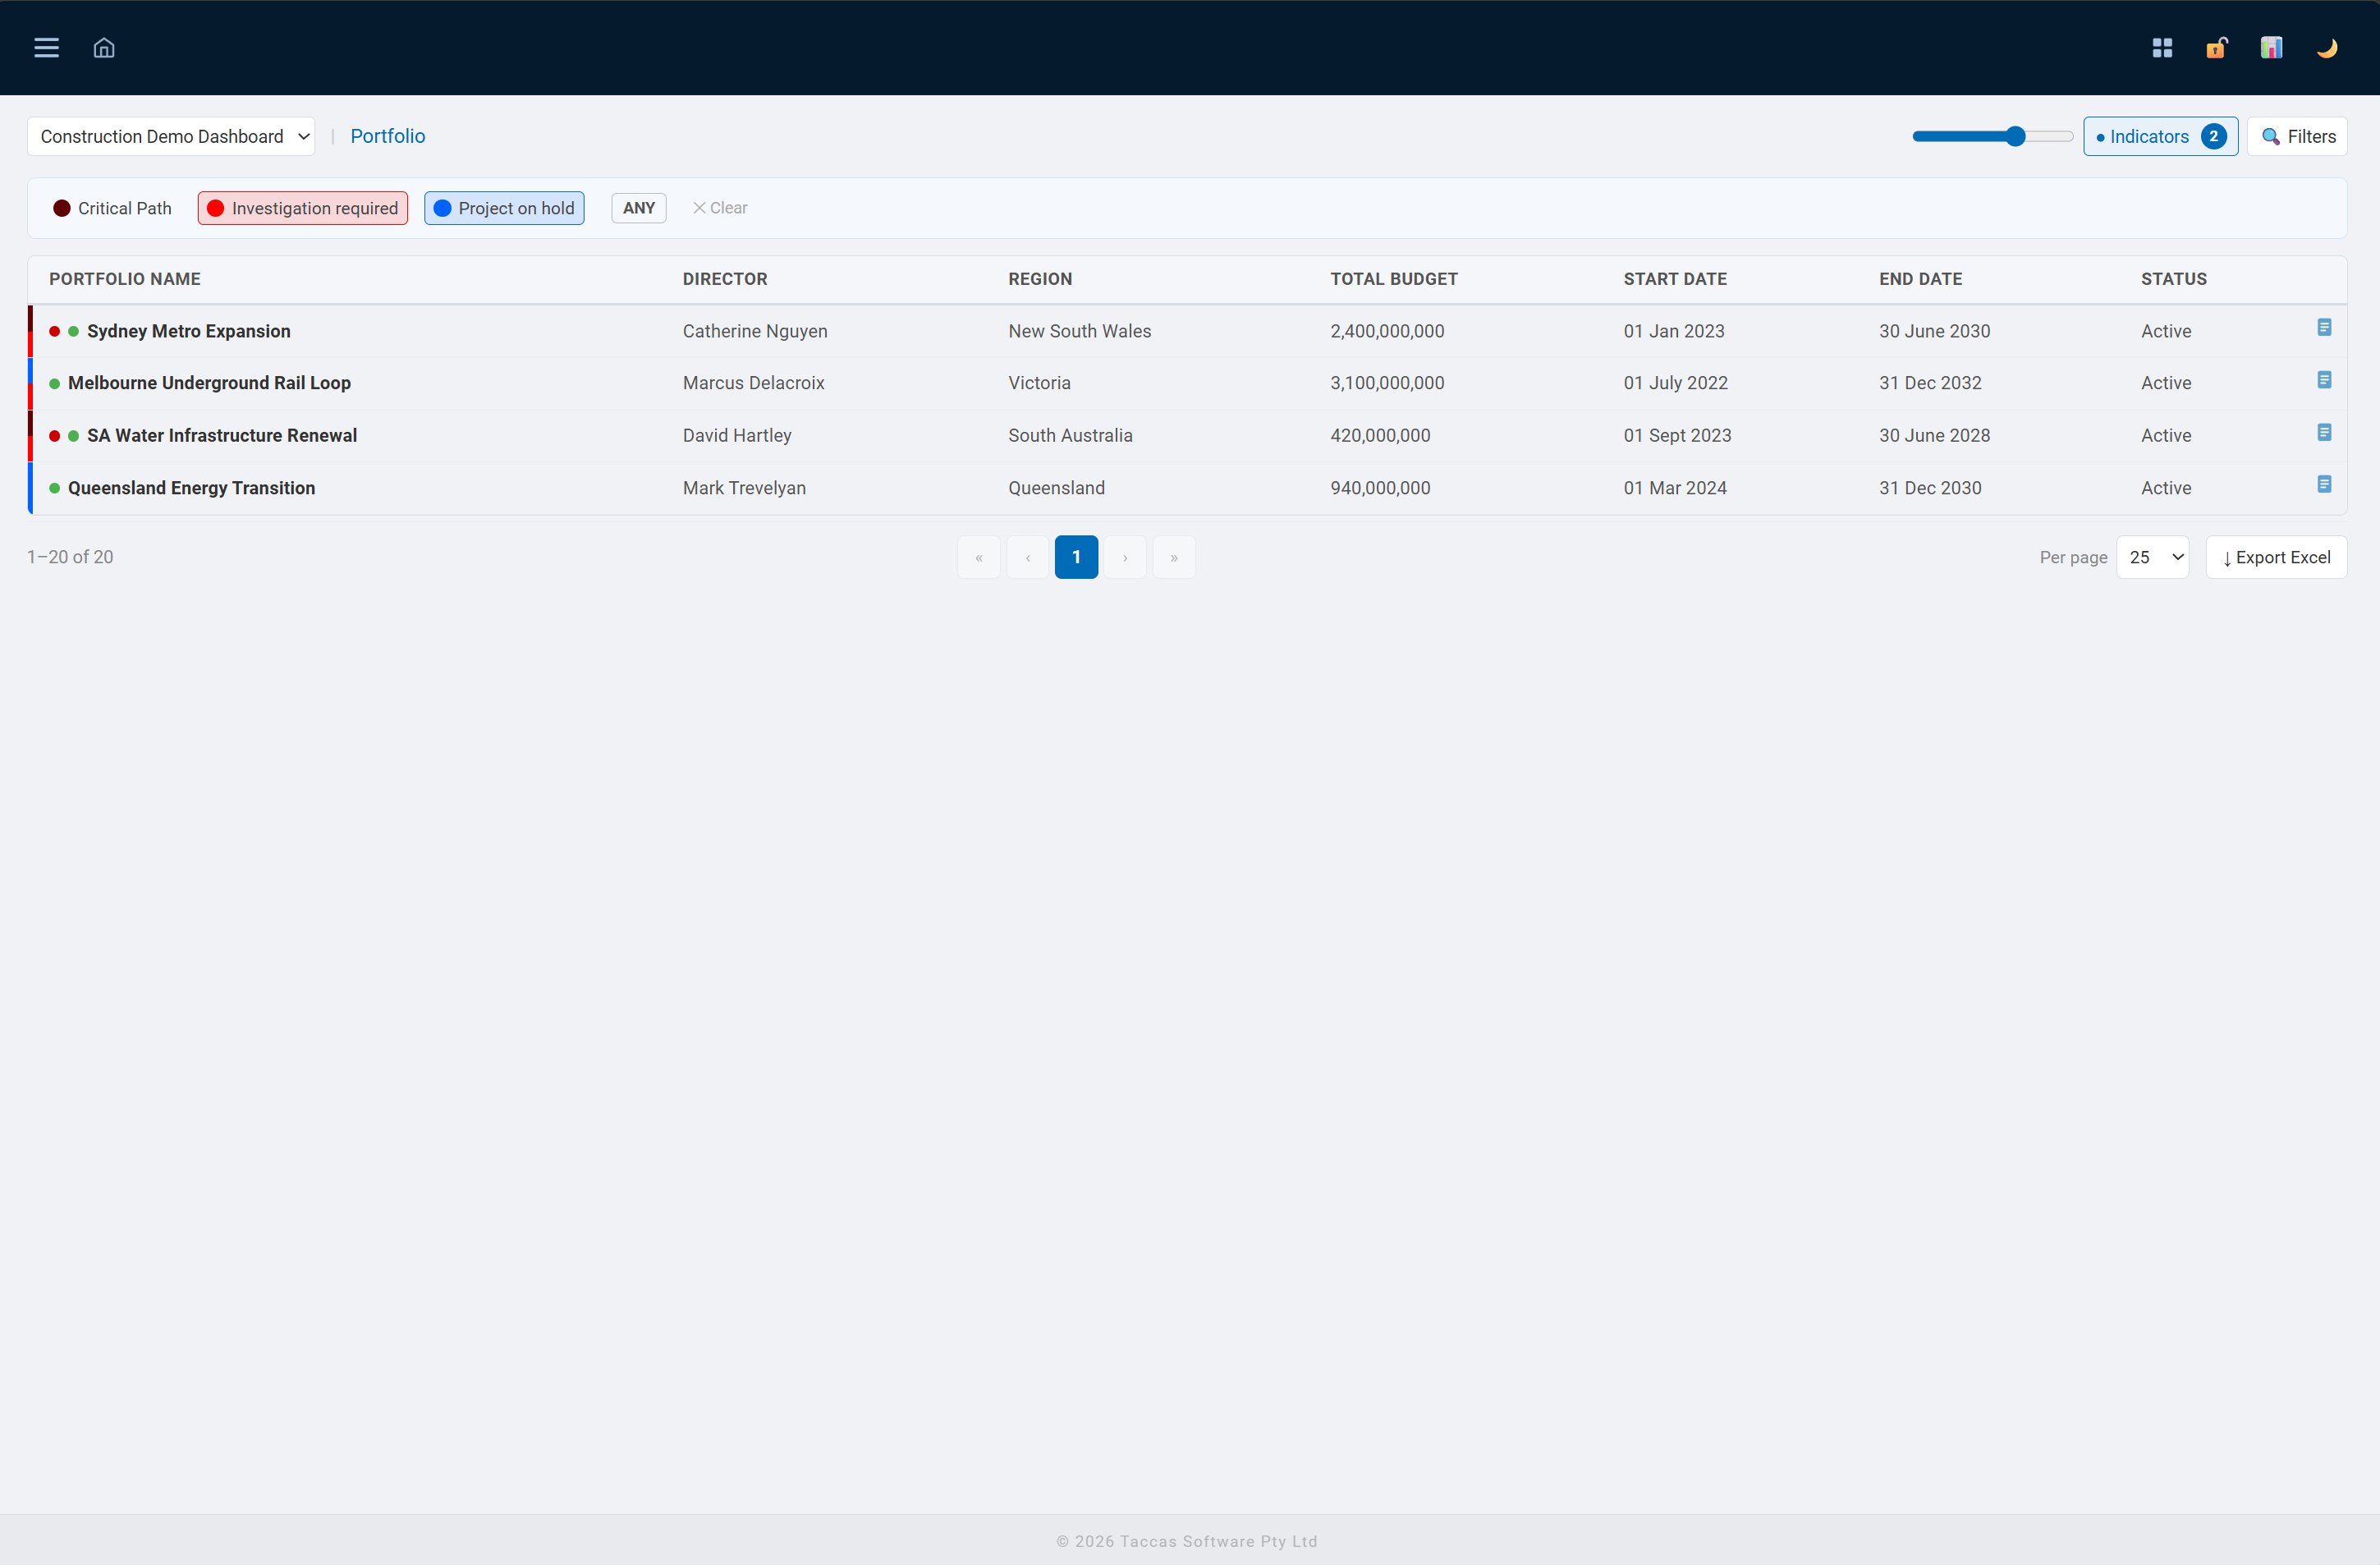
Switch to list view for a paginated table of all records at the current level. All the same data, sorted and scannable. Export any view directly to a properly formatted Excel workbook.
- Paginated with OFFSET/FETCH — handles datasets of any size
- Sortable by any configured column
- Indicator dots visible per row — same colour coding as tile view
- Progress bars shown in a dedicated column where configured
- Export Excel — bold headers, auto-width columns, numeric formatting
- Hover tooltip available on list rows — same as tile view
Find what matters.
Filter everything else out.
The indicator filter bar lets users filter tiles or list rows by any combination of active indicators. Select one or more indicators and toggle between ANY match (show records with at least one selected indicator active) or ALL match (show only records with every selected indicator active).
- Indicator filter bar — select any combination of configured indicators
- ANY / ALL toggle — flexible matching for multi-indicator queries
- Field filters — dropdown and range filters per level, configured by admins
- Active filters shown as pills with a clear button
- Filter preferences saved per user per level between sessions
- Indicator count badge on the Indicators button shows active count
Every record.
Fully configured.
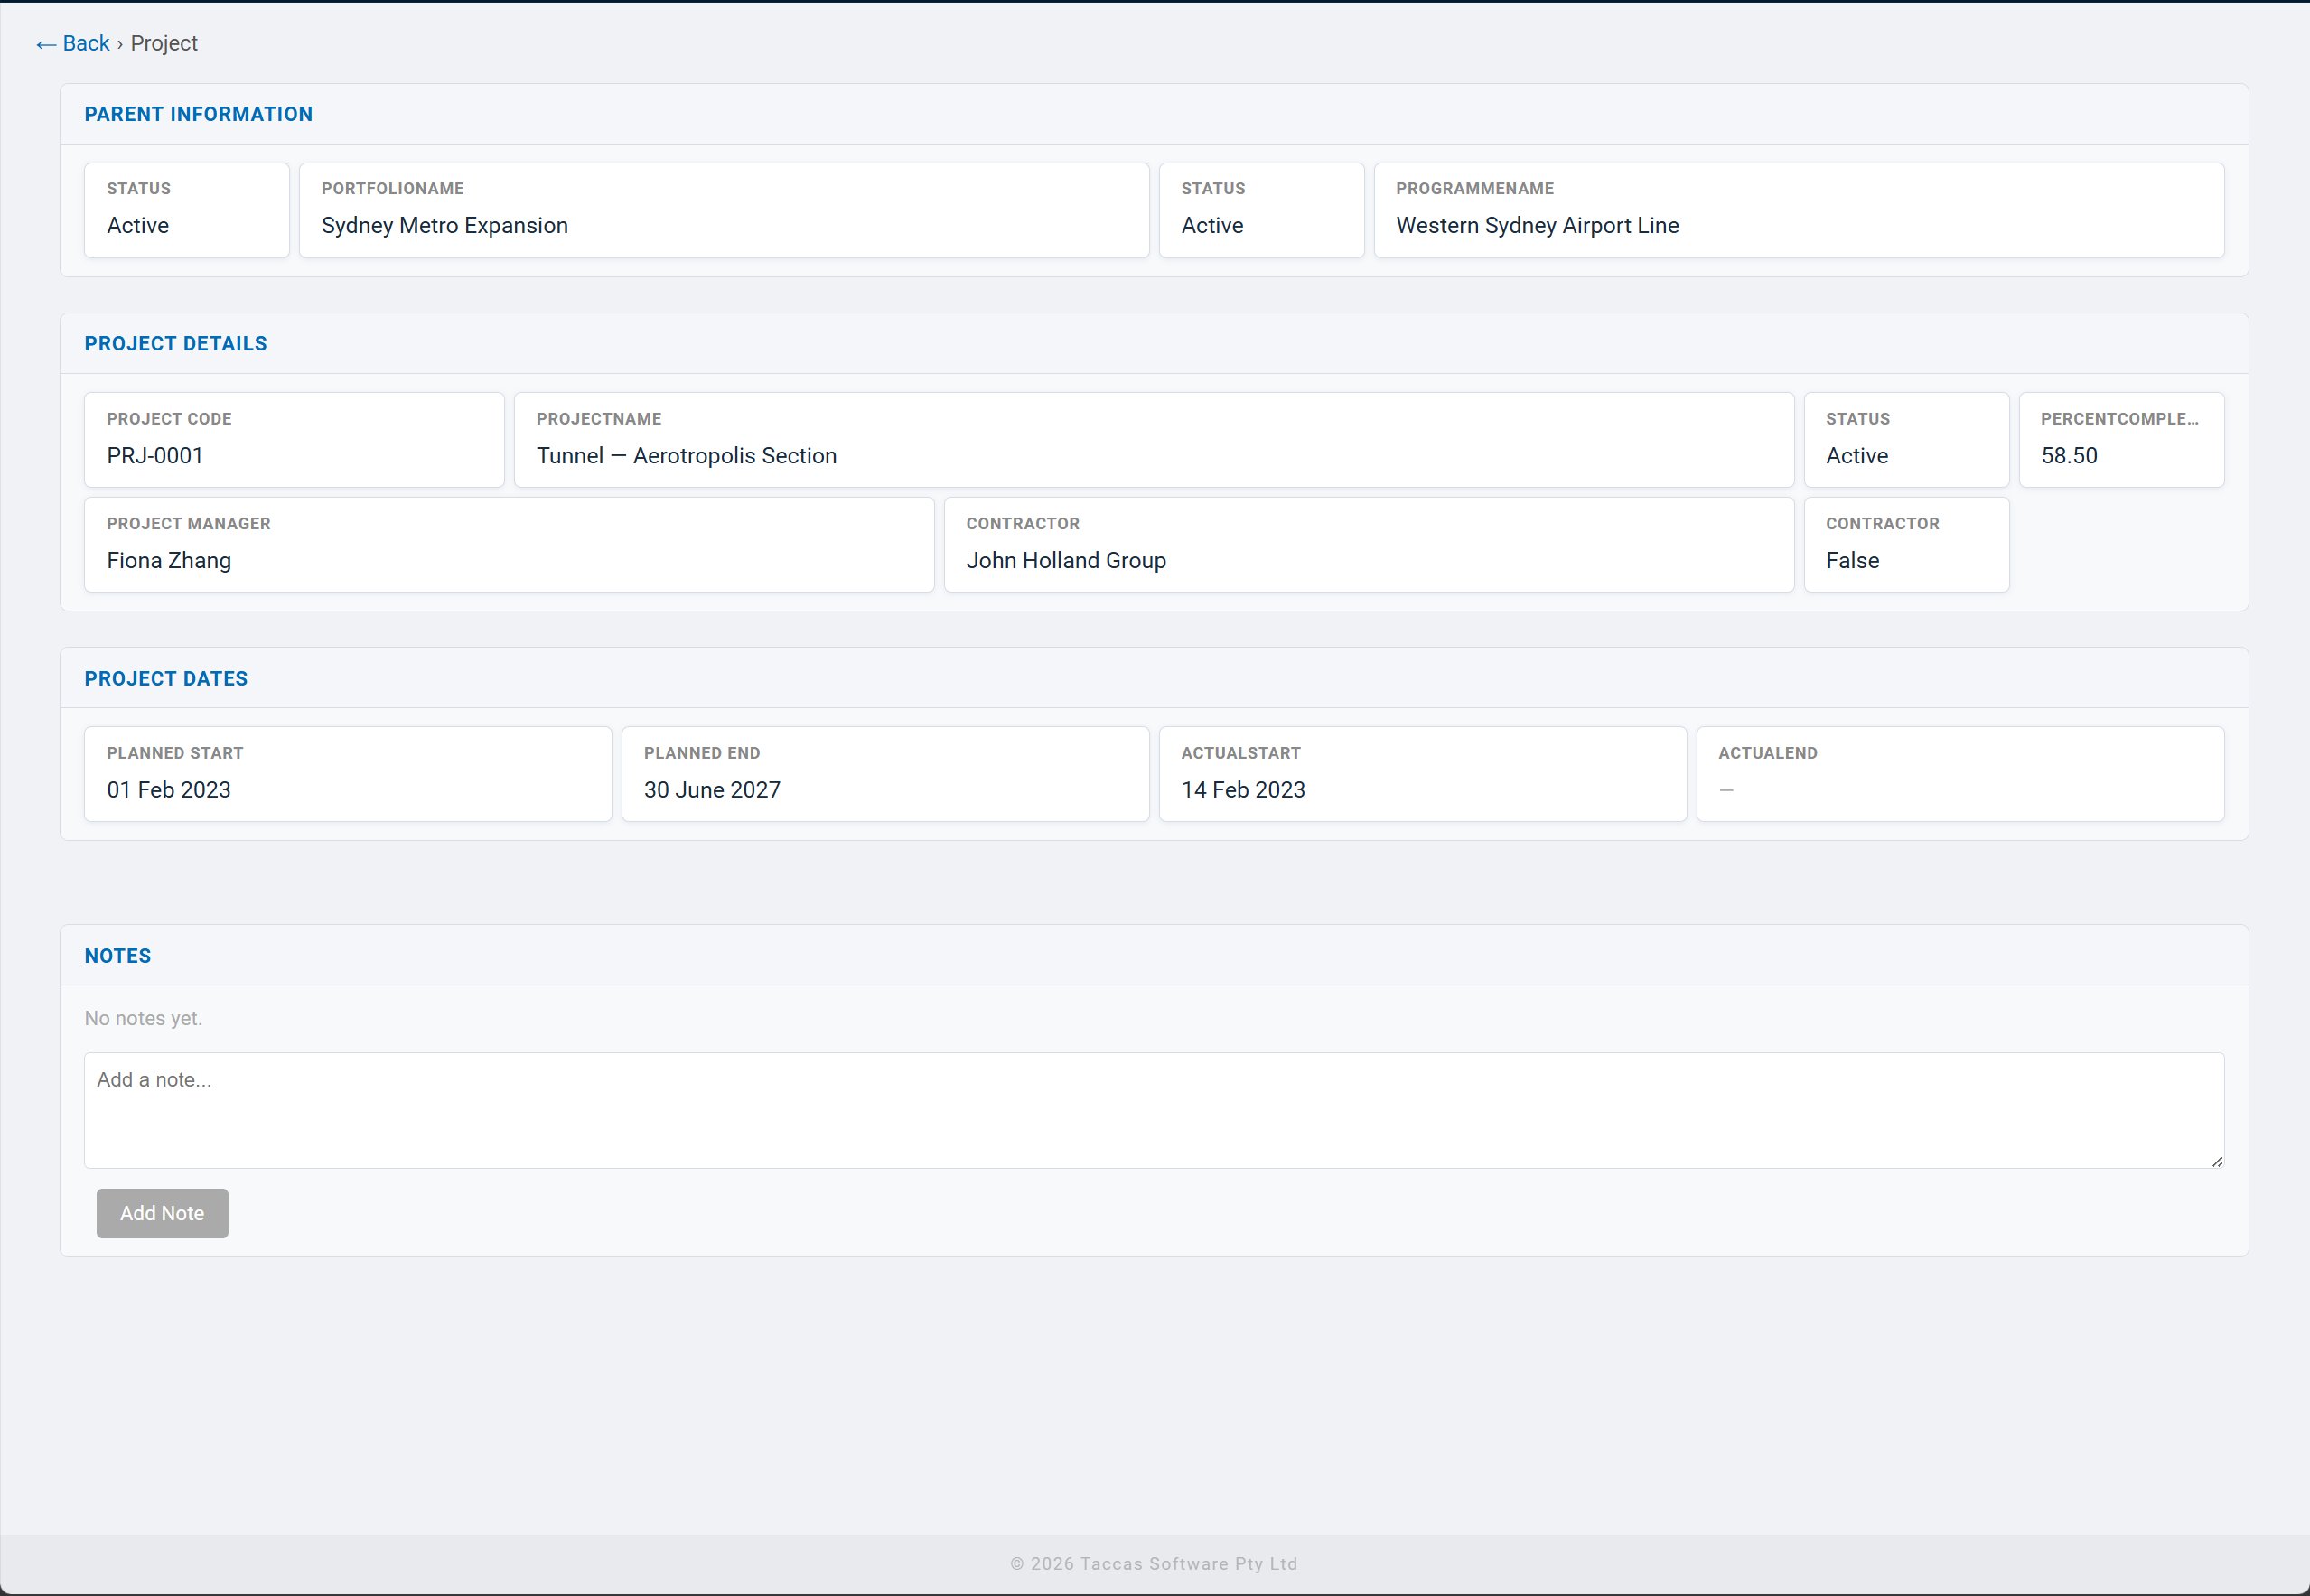
Clicking any tile or list row opens the full record detail view. Sections, fields, and column widths are all defined by administrators — no code required. The detail view also shows parent record information, analysis check results, side structures, and notes.
- Admin-configured sections — group related fields logically
- Column widths set per field as percentages with live preview in admin
- Parent information shown at the top — always know the context
- Side structures — linked data from other tables shown as additional sections
- Analysis check results shown — which conditions triggered and why
- Notes section — add notes with optional expiry date
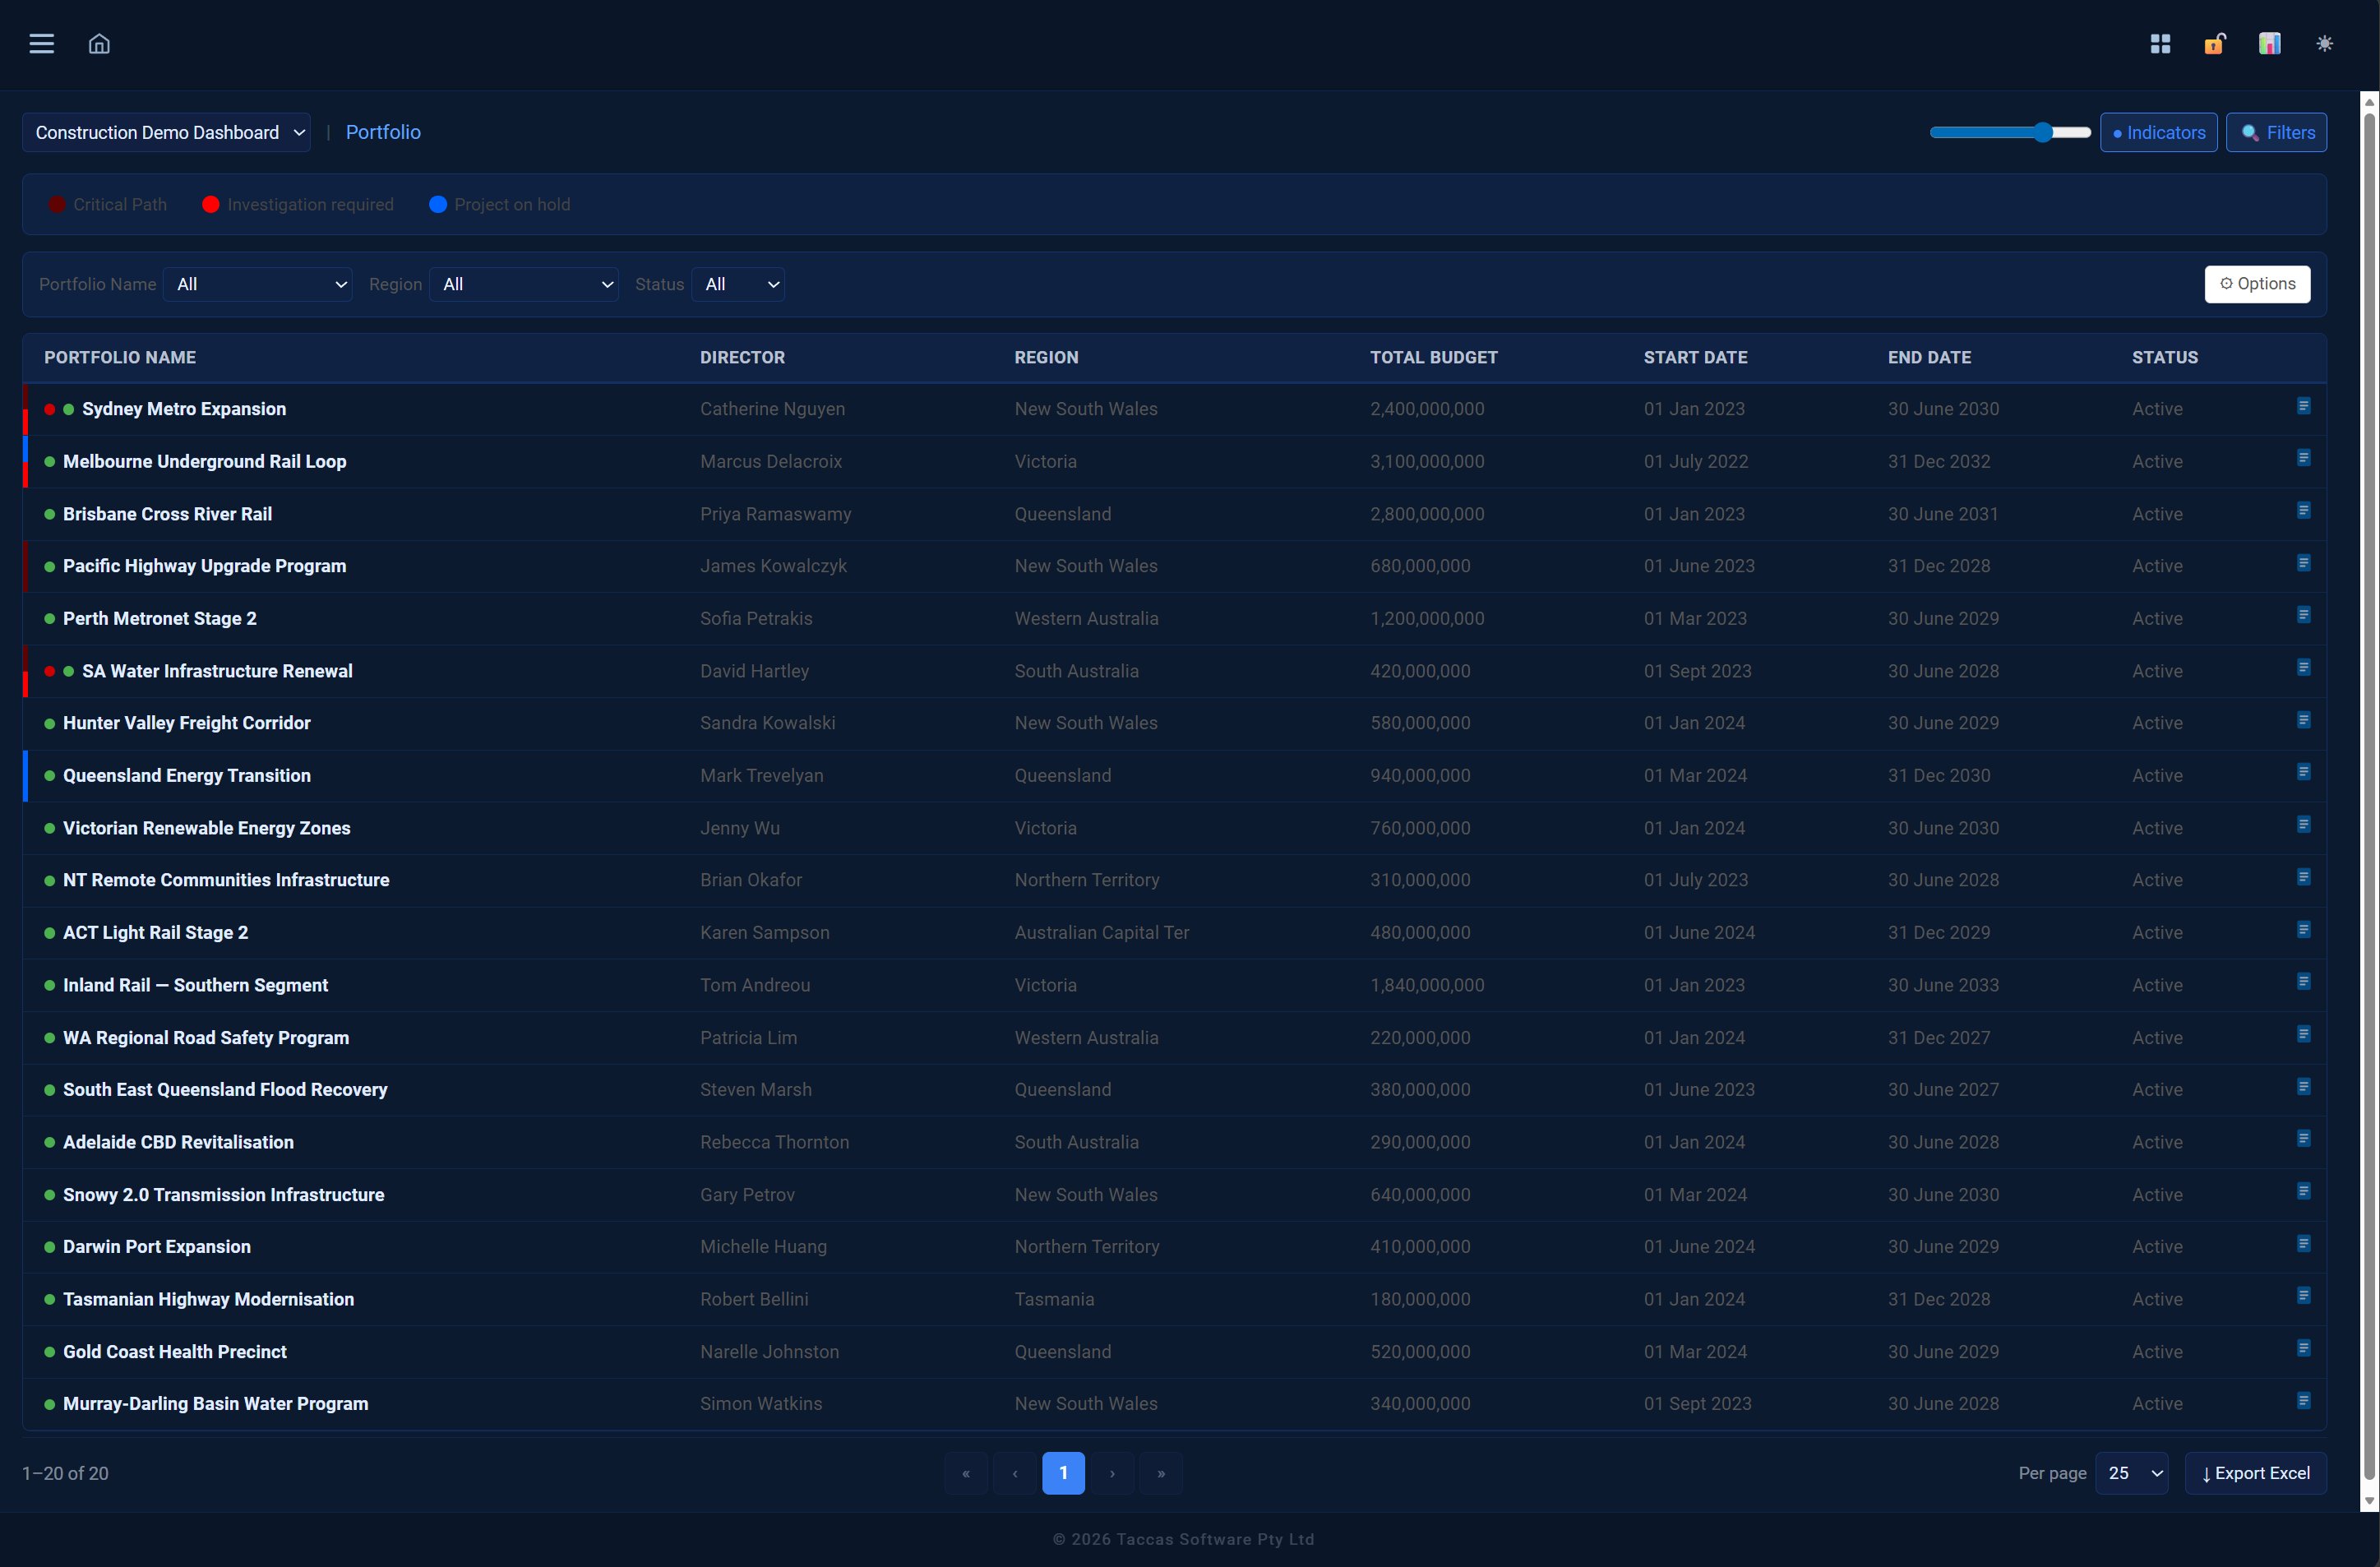
Light and dark mode.
Per user, persisted.
Every user can toggle between light and dark themes. The preference is saved to their account — the dashboard opens in their chosen theme every time they log in. The organisation-wide font and progress bar style are set by administrators in the Appearance settings.
Light theme
Dark theme
Want to see it with your data?
Contact Taccas Software to discuss how VisualDashboard can work with your existing SQL Server databases.
Contact Taccas