Analytics
Turn everyday information into answers people can use.
Highlight important conditions, create useful values, bring detailed numbers together and let people focus the dashboard on what matters to them.
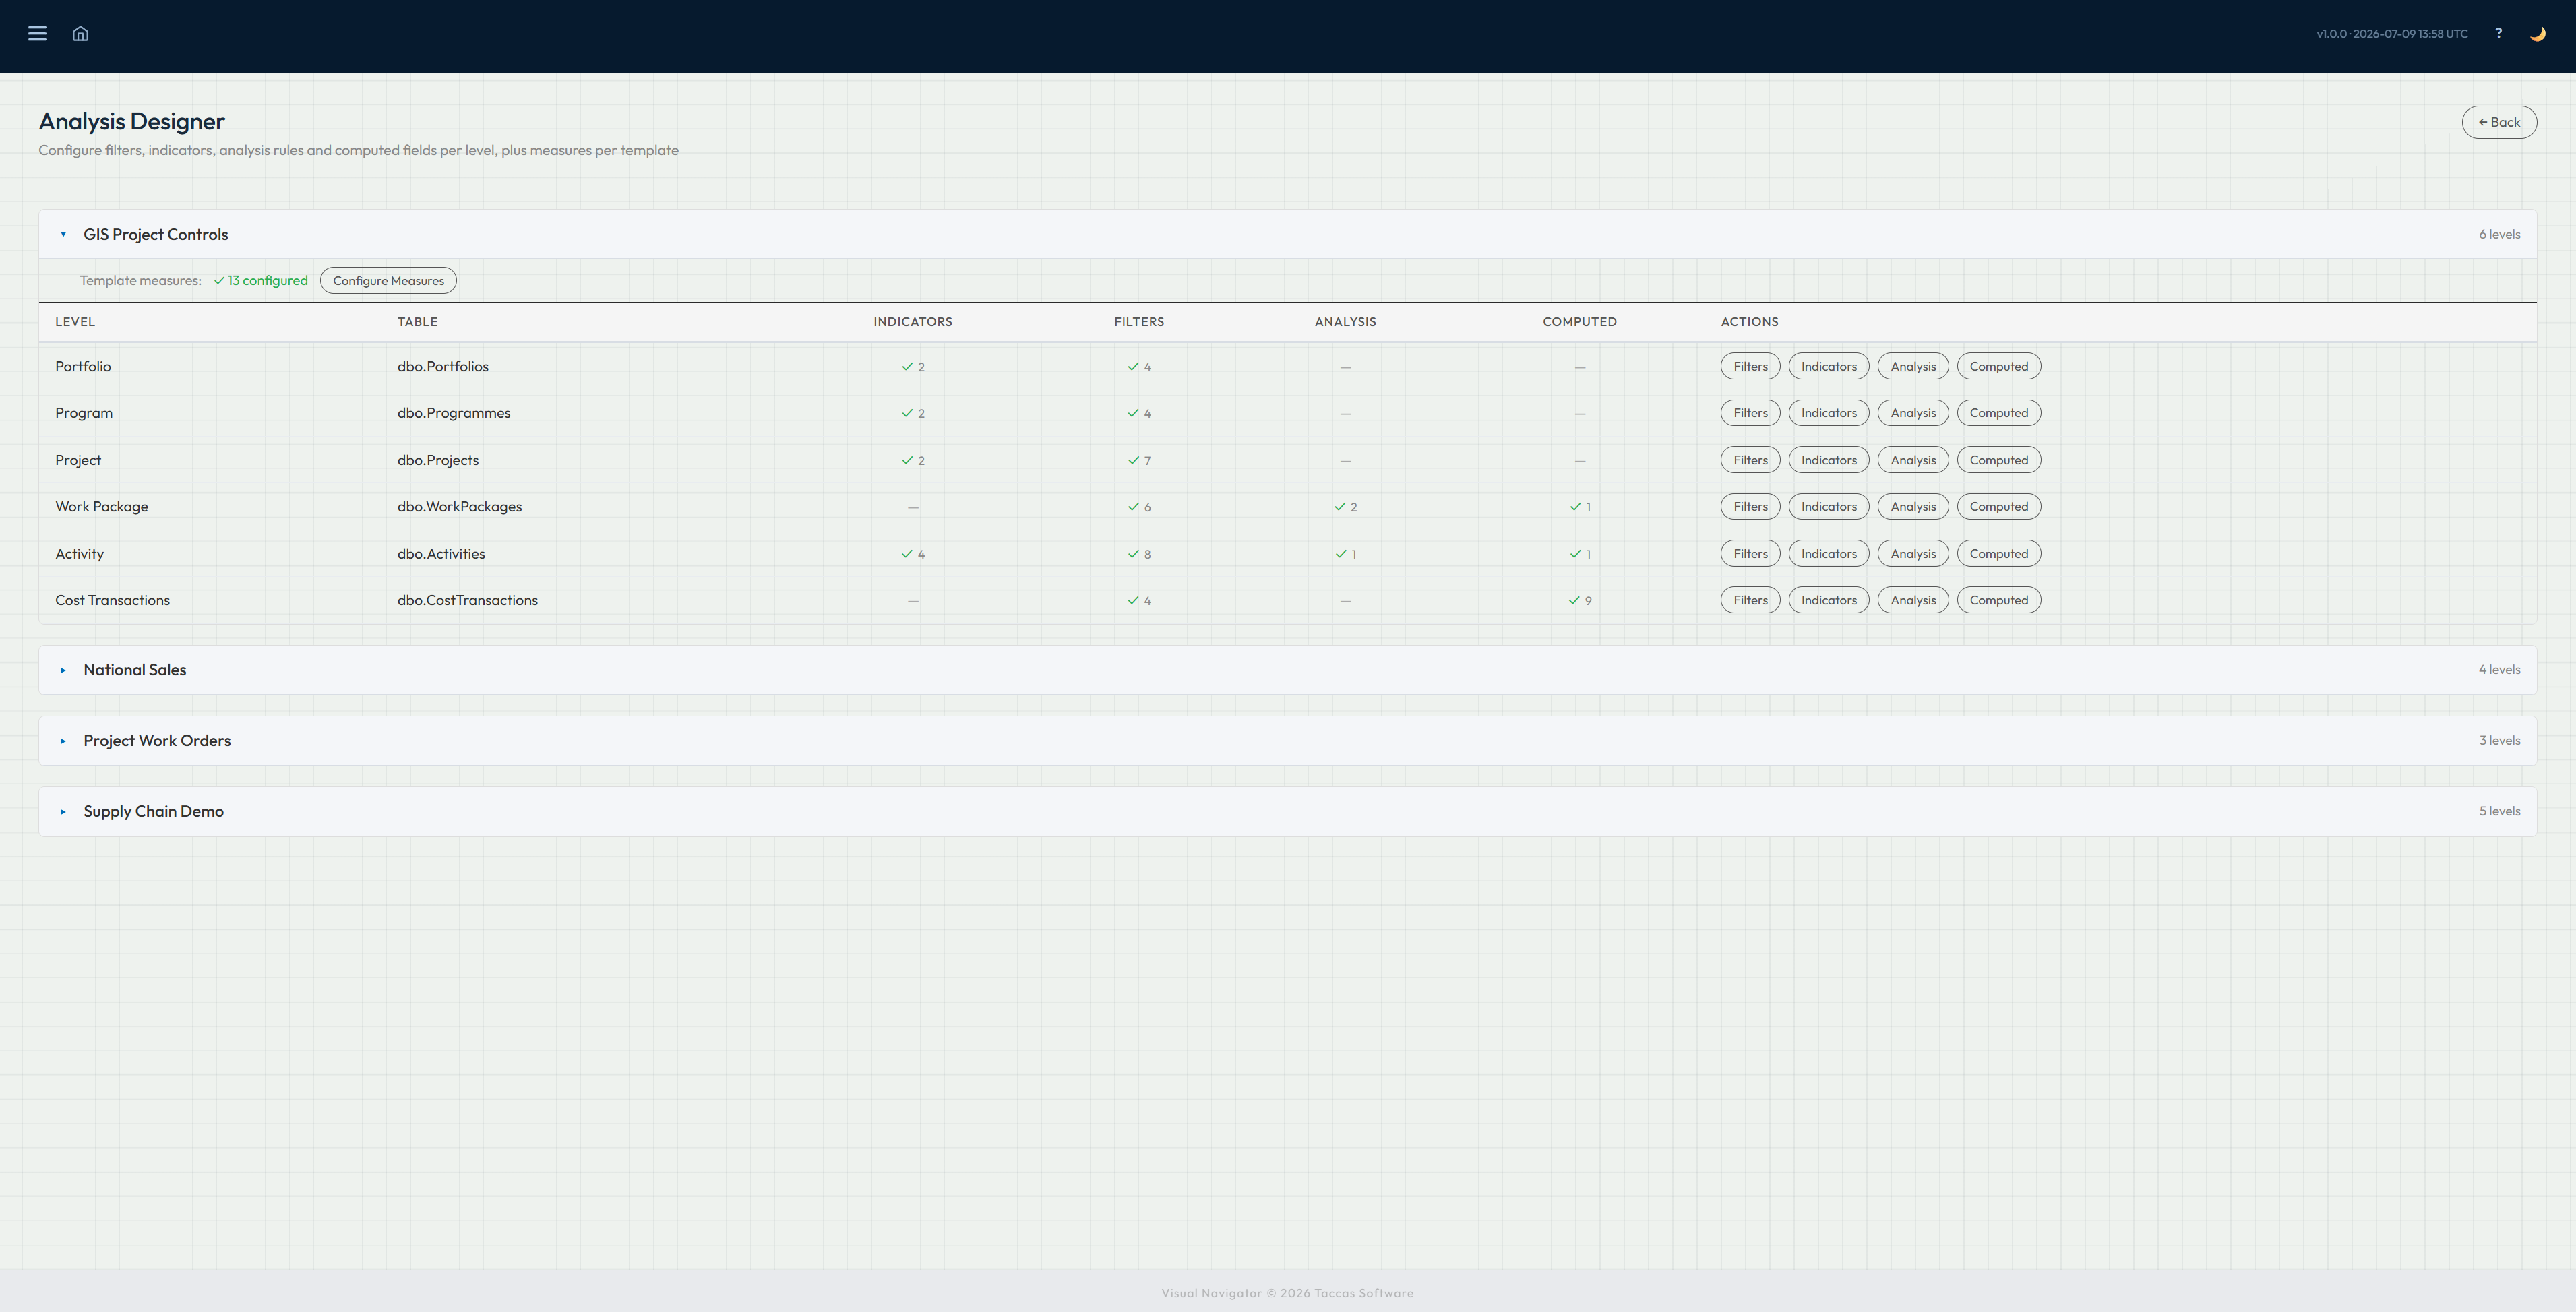
Analysis Designer
Keep every analytical choice together.
The Analysis Designer shows the indicators, filters, analysis rules and computed values available at every stage of a dashboard, with measures managed from the same place.
The names in this example come from project controls data, but Navi is not limited to projects. These tools work with the stages, records and fields in any suitable Excel workbook or connected business database.
Indicators
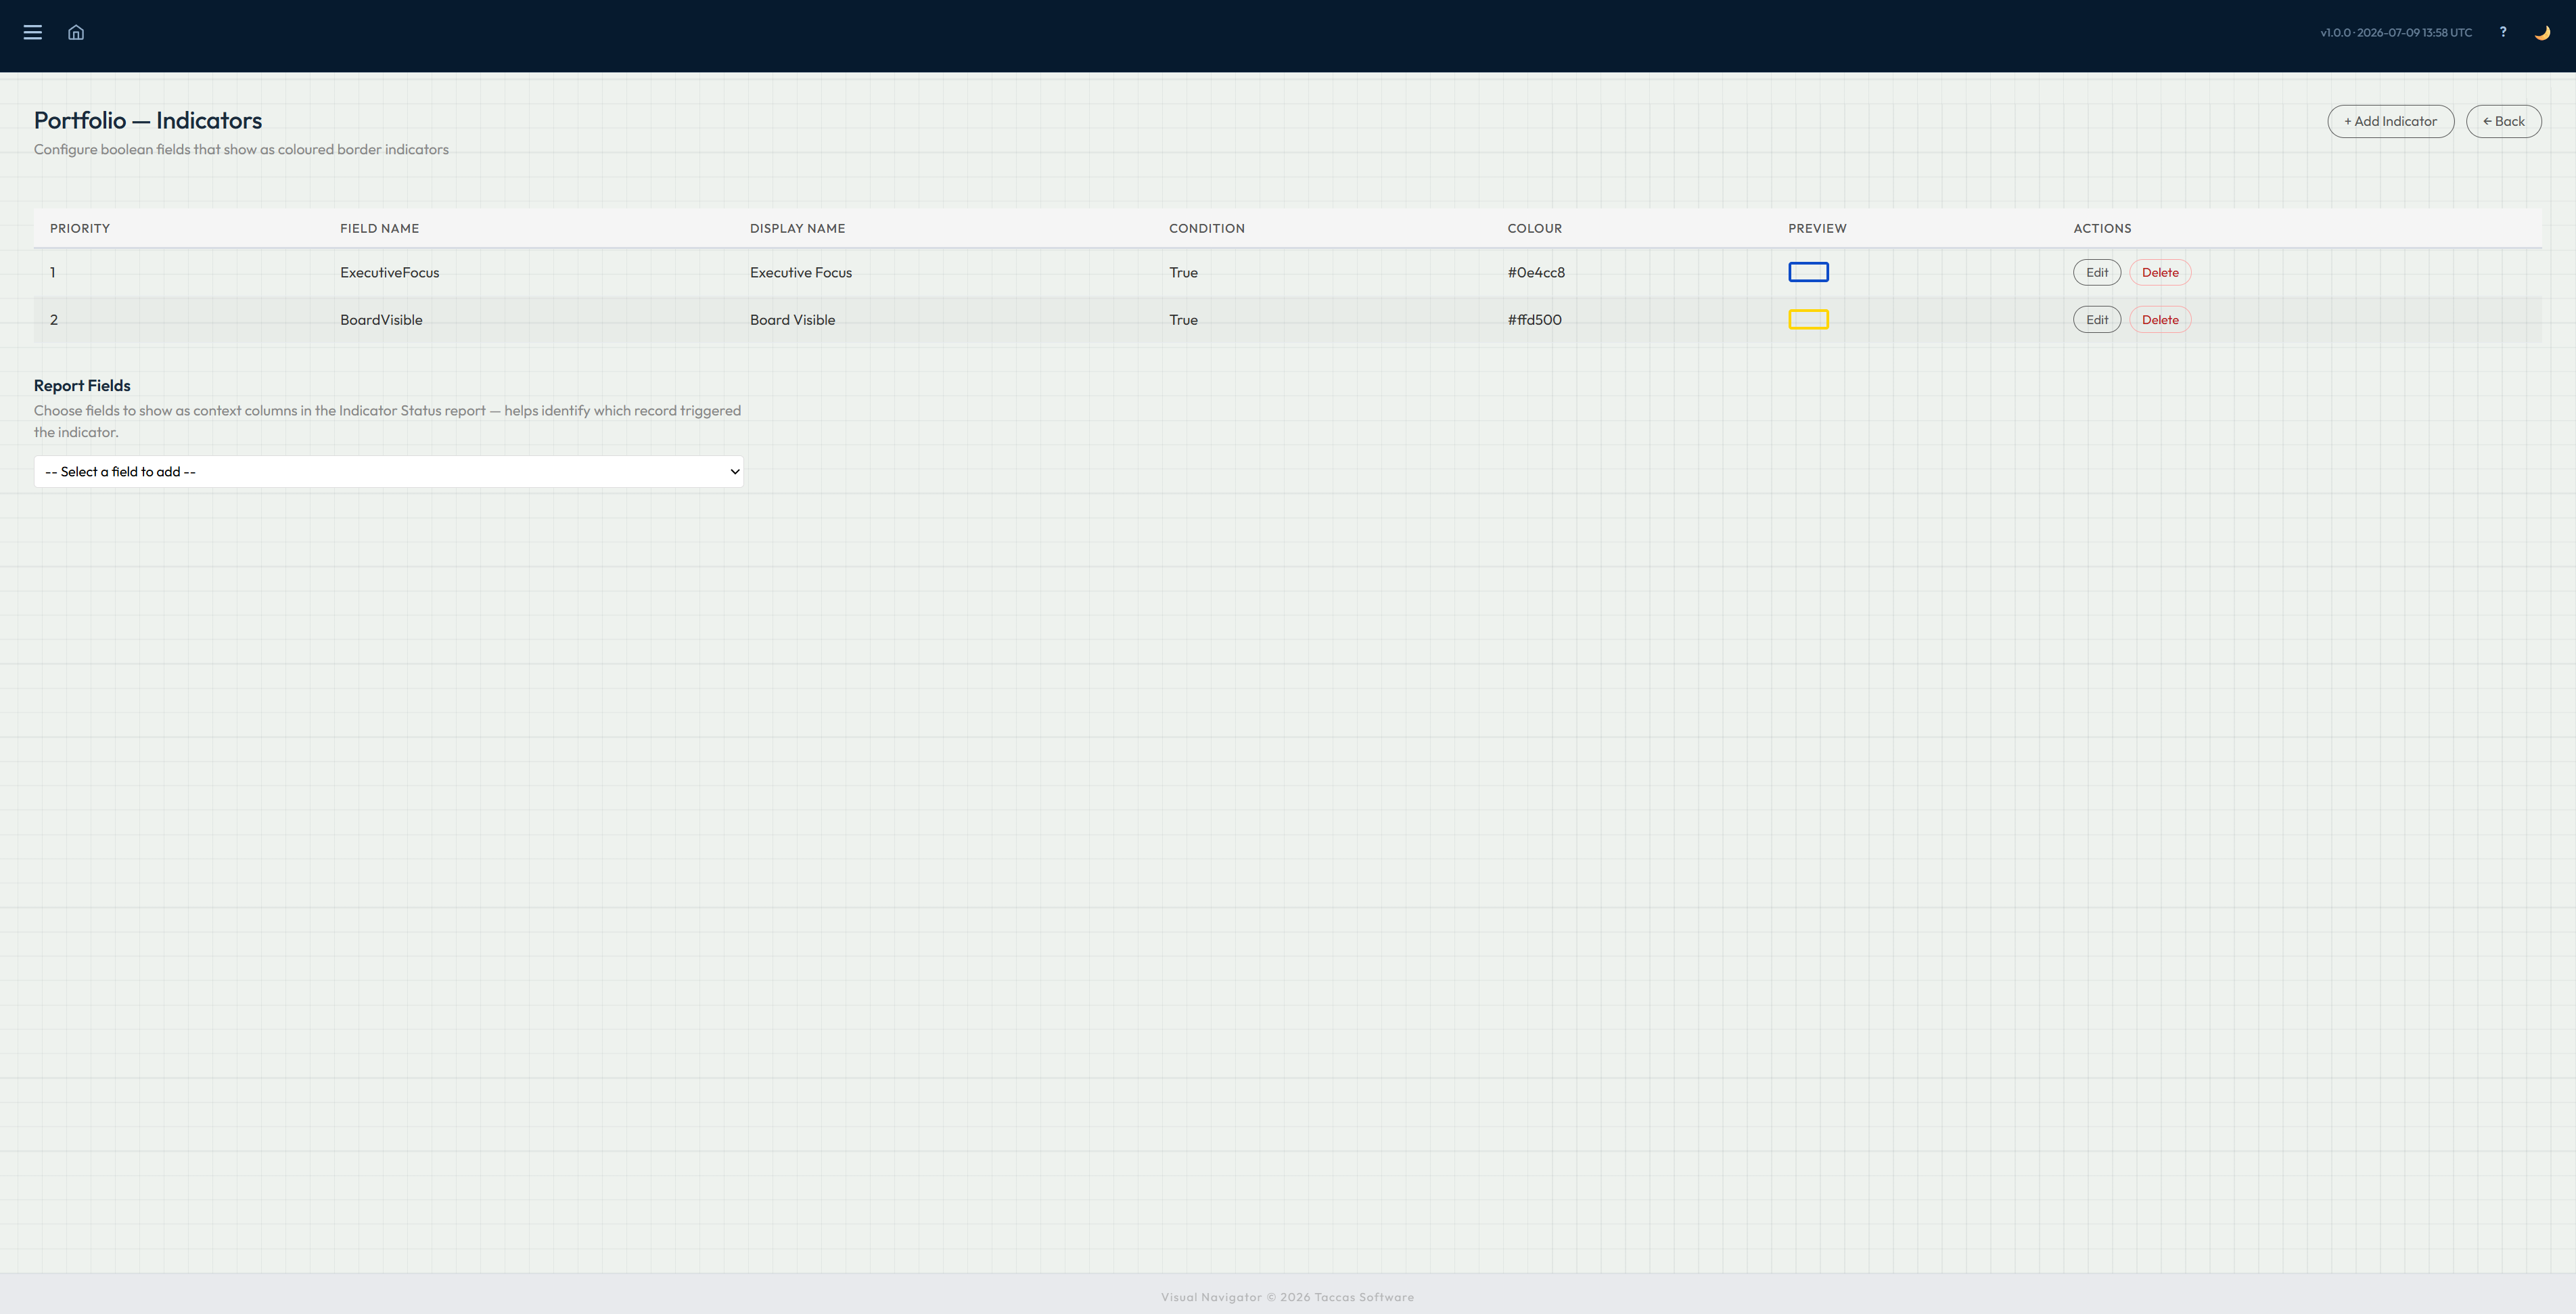
Make important conditions visible at a glance.
Choose a piece of information that represents something people need to notice, give it a clear name and select its colour. When a record matches, Navi places that coloured marker on the dashboard so people can see it before opening the record.
Indicators can represent anything in your information: approval, priority, inclusion in a board pack, a service condition or another meaningful yes-or-no choice. You can also choose the order in which markers appear and which identifying details are included in the Indicator Status report.
Computed values
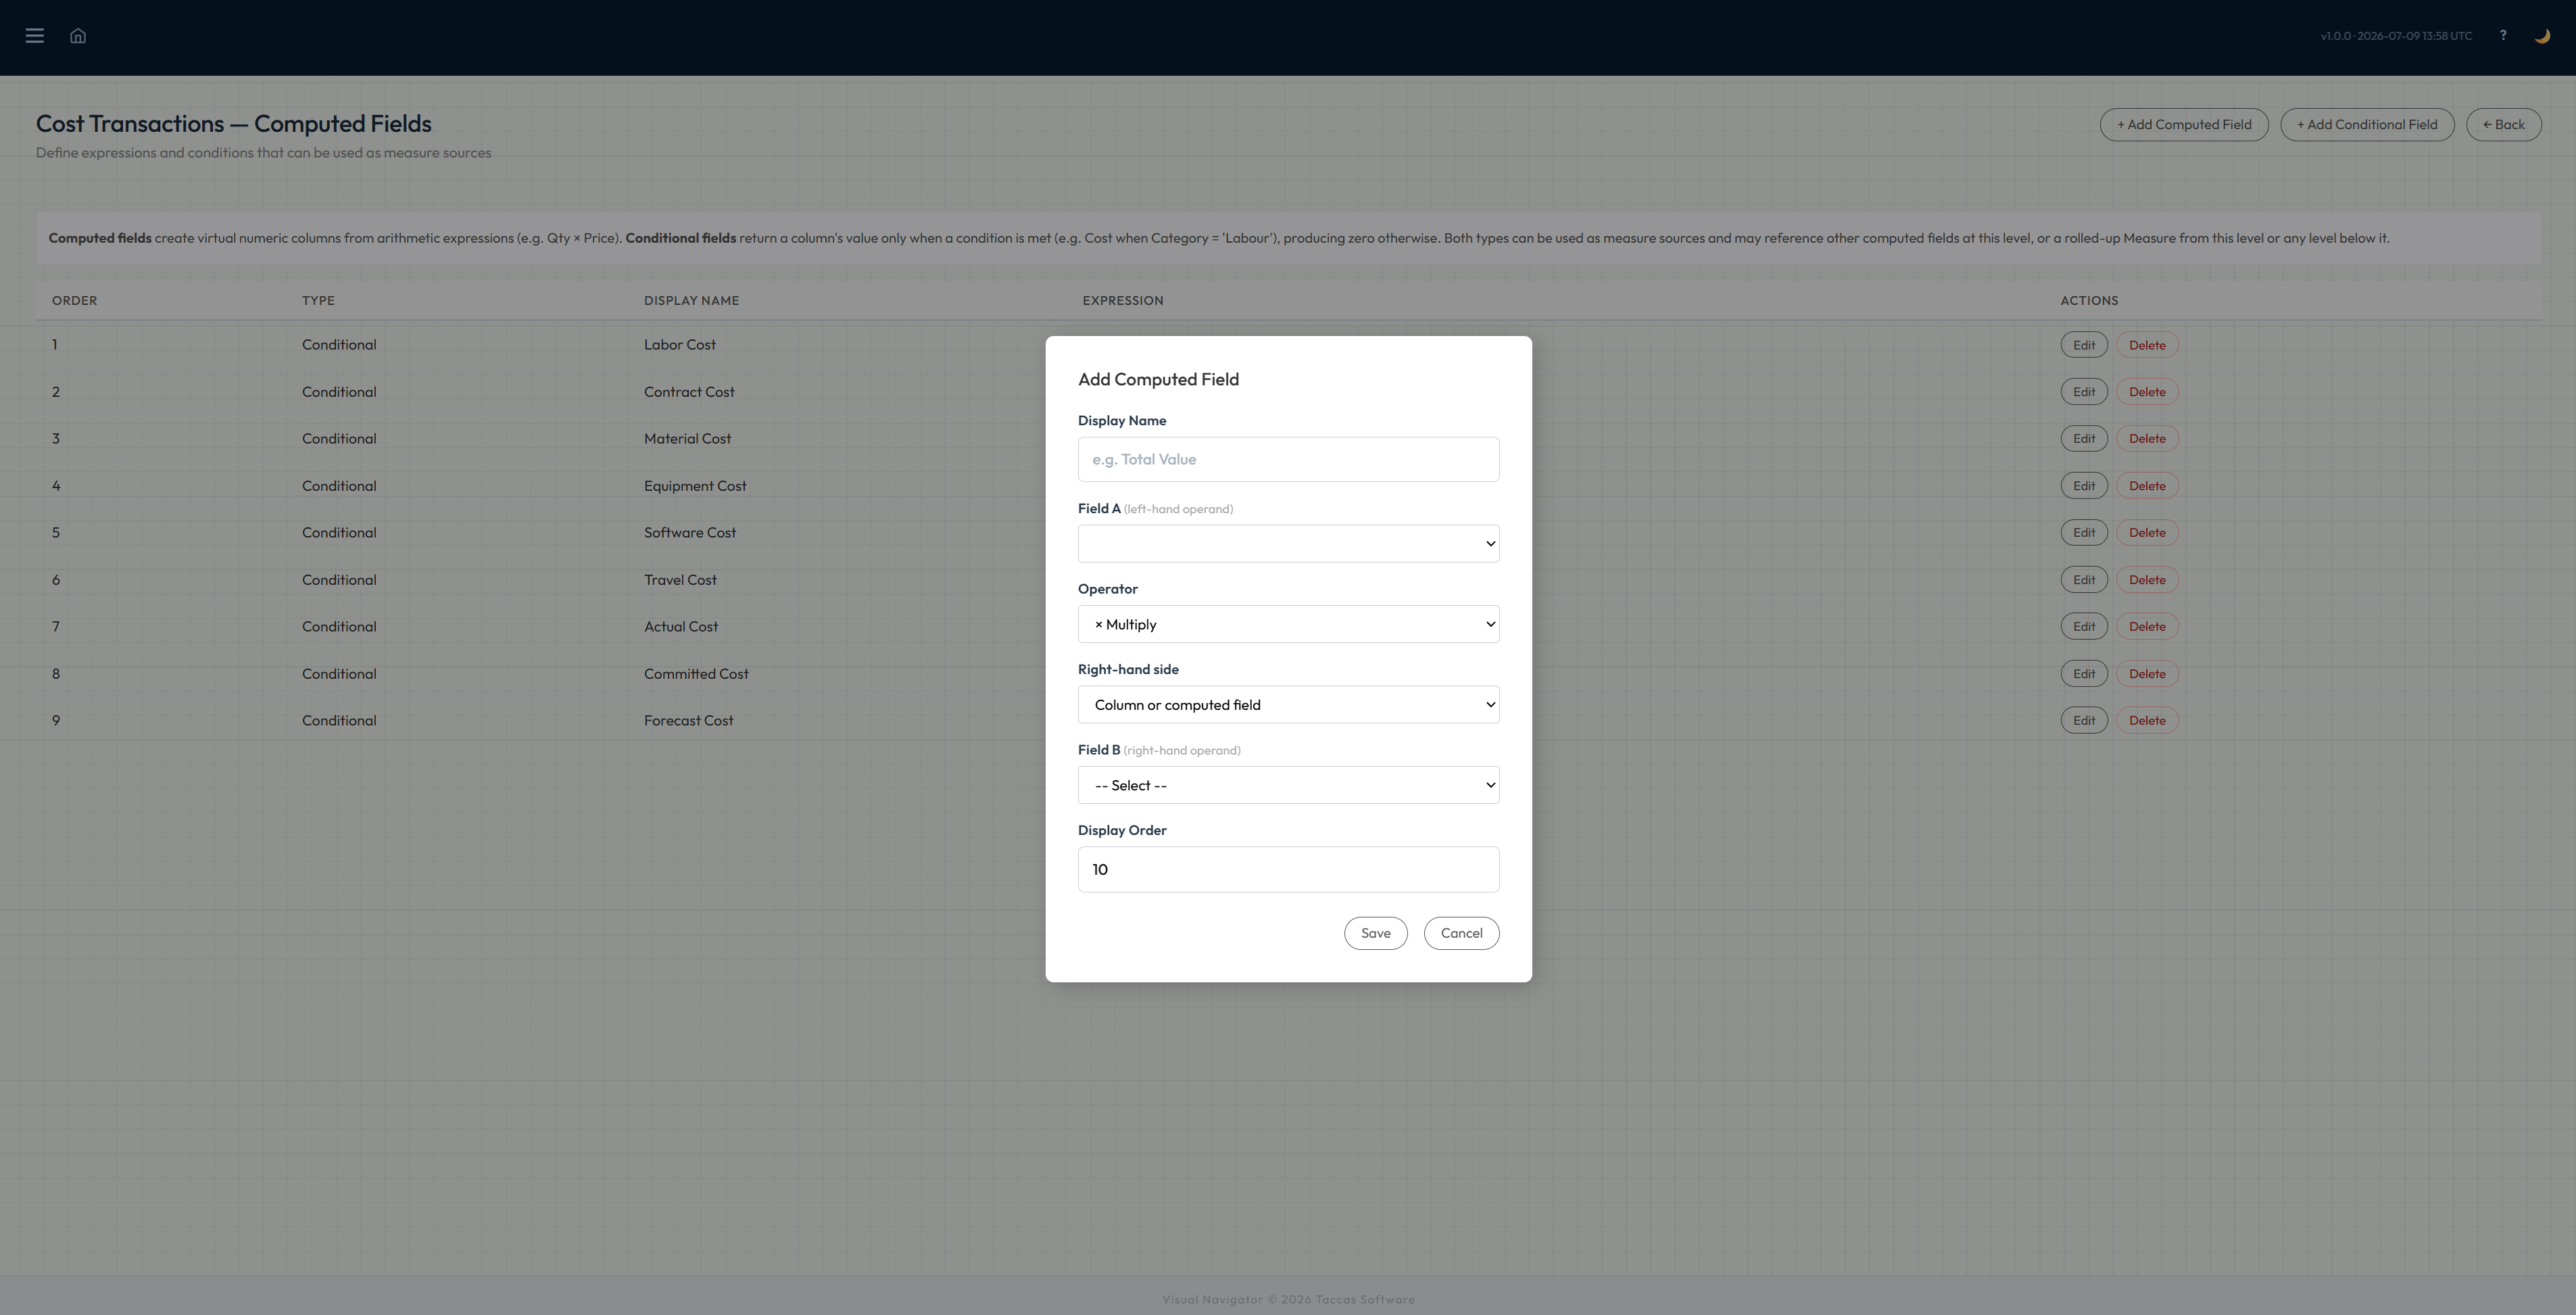
Create useful numbers from information you already have.
Name the result, choose the first value, select the calculation and then choose the second value. Navi can add, subtract, multiply or divide values without asking someone to alter the original workbook or database.
This could calculate quantity multiplied by price, the difference between budget and forecast, remaining capacity or any other result that fits your information. The new value can then appear on tiles, lists and record pages, or be used in a larger total.
Conditional computed fields
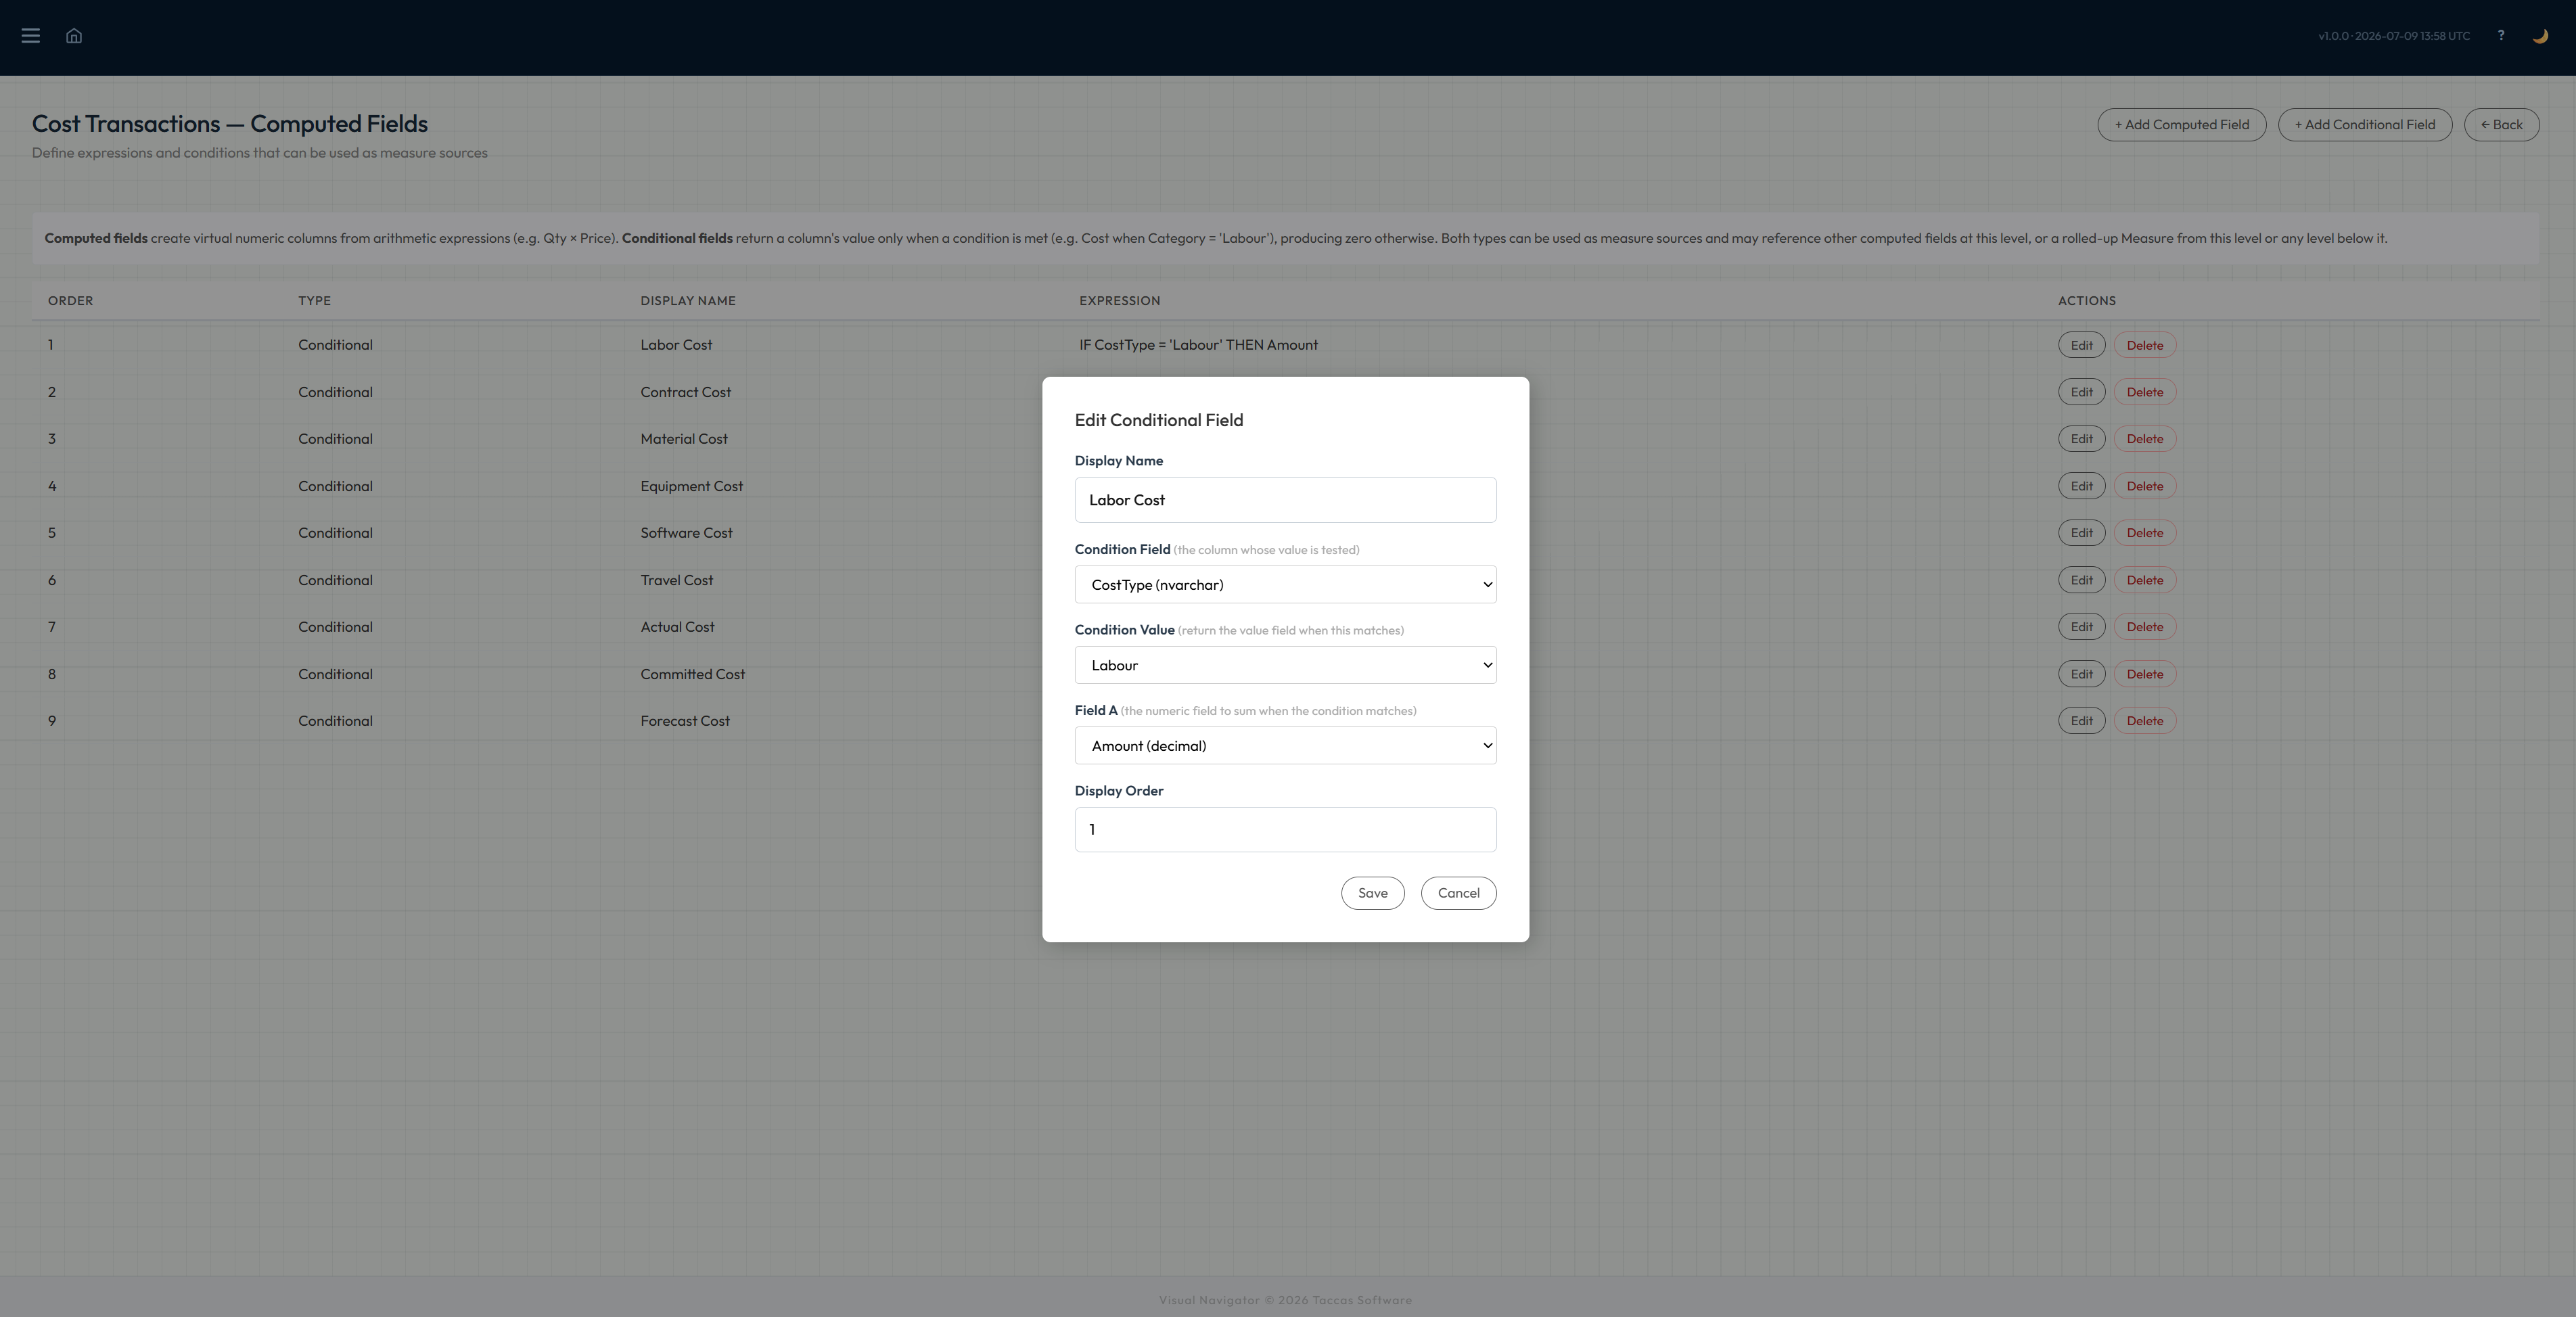
Use a value only when a chosen condition is met.
Sometimes a number is useful only for one kind of record. Choose the information Navi should check, the value it must match and the number to return when it does. Navi produces zero for records that do not match, making the result ready to total or compare.
In the example, an amount becomes Labour Cost only when Cost Type is Labour. The same approach can separate income types, service categories, regions, product groups or any other classifications held in your own information.
Analysis
Bring exceptions forward before they are overlooked.
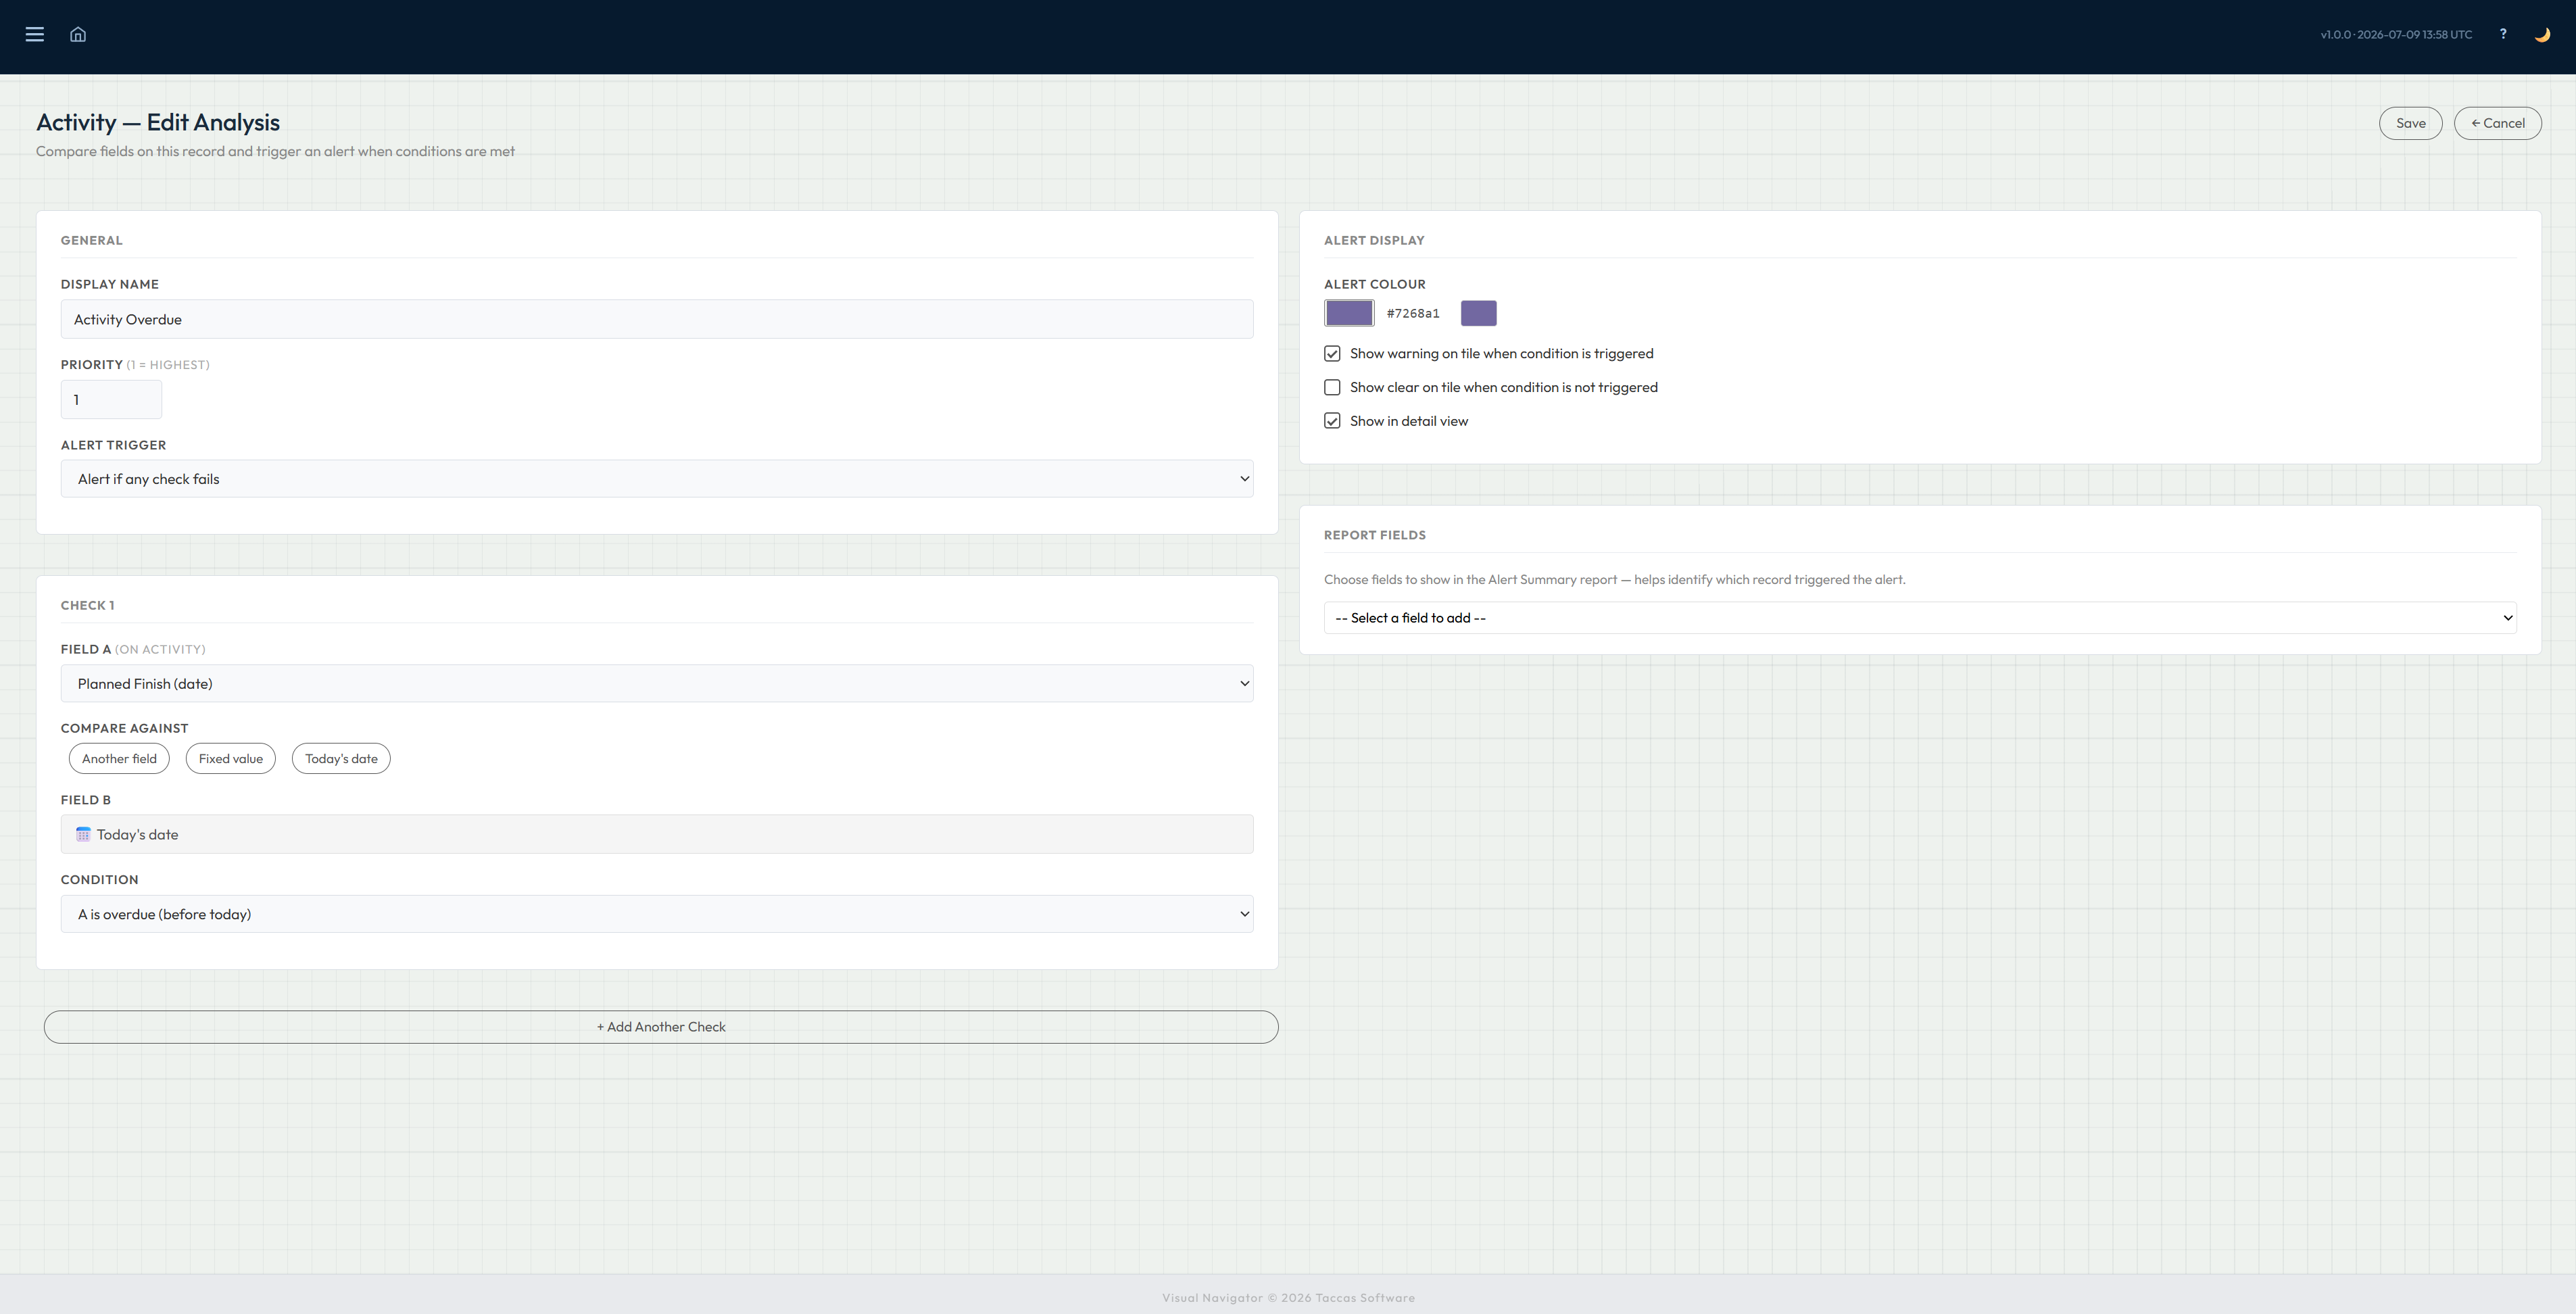
Choose what Navi should check and what counts as a problem. A value can be compared with another value, a limit you set or today's date. You then choose the warning name, colour and priority, and decide which supporting details people should see.
The example identifies an overdue activity by checking whether its planned finish date has passed. Your rules can instead watch costs, stock, service dates, cases, orders, performance or any other information relevant to your organisation. Matching records remain visible on the dashboard and are gathered in the Alert Summary report.
Measures
Bring detailed numbers together higher up the dashboard.
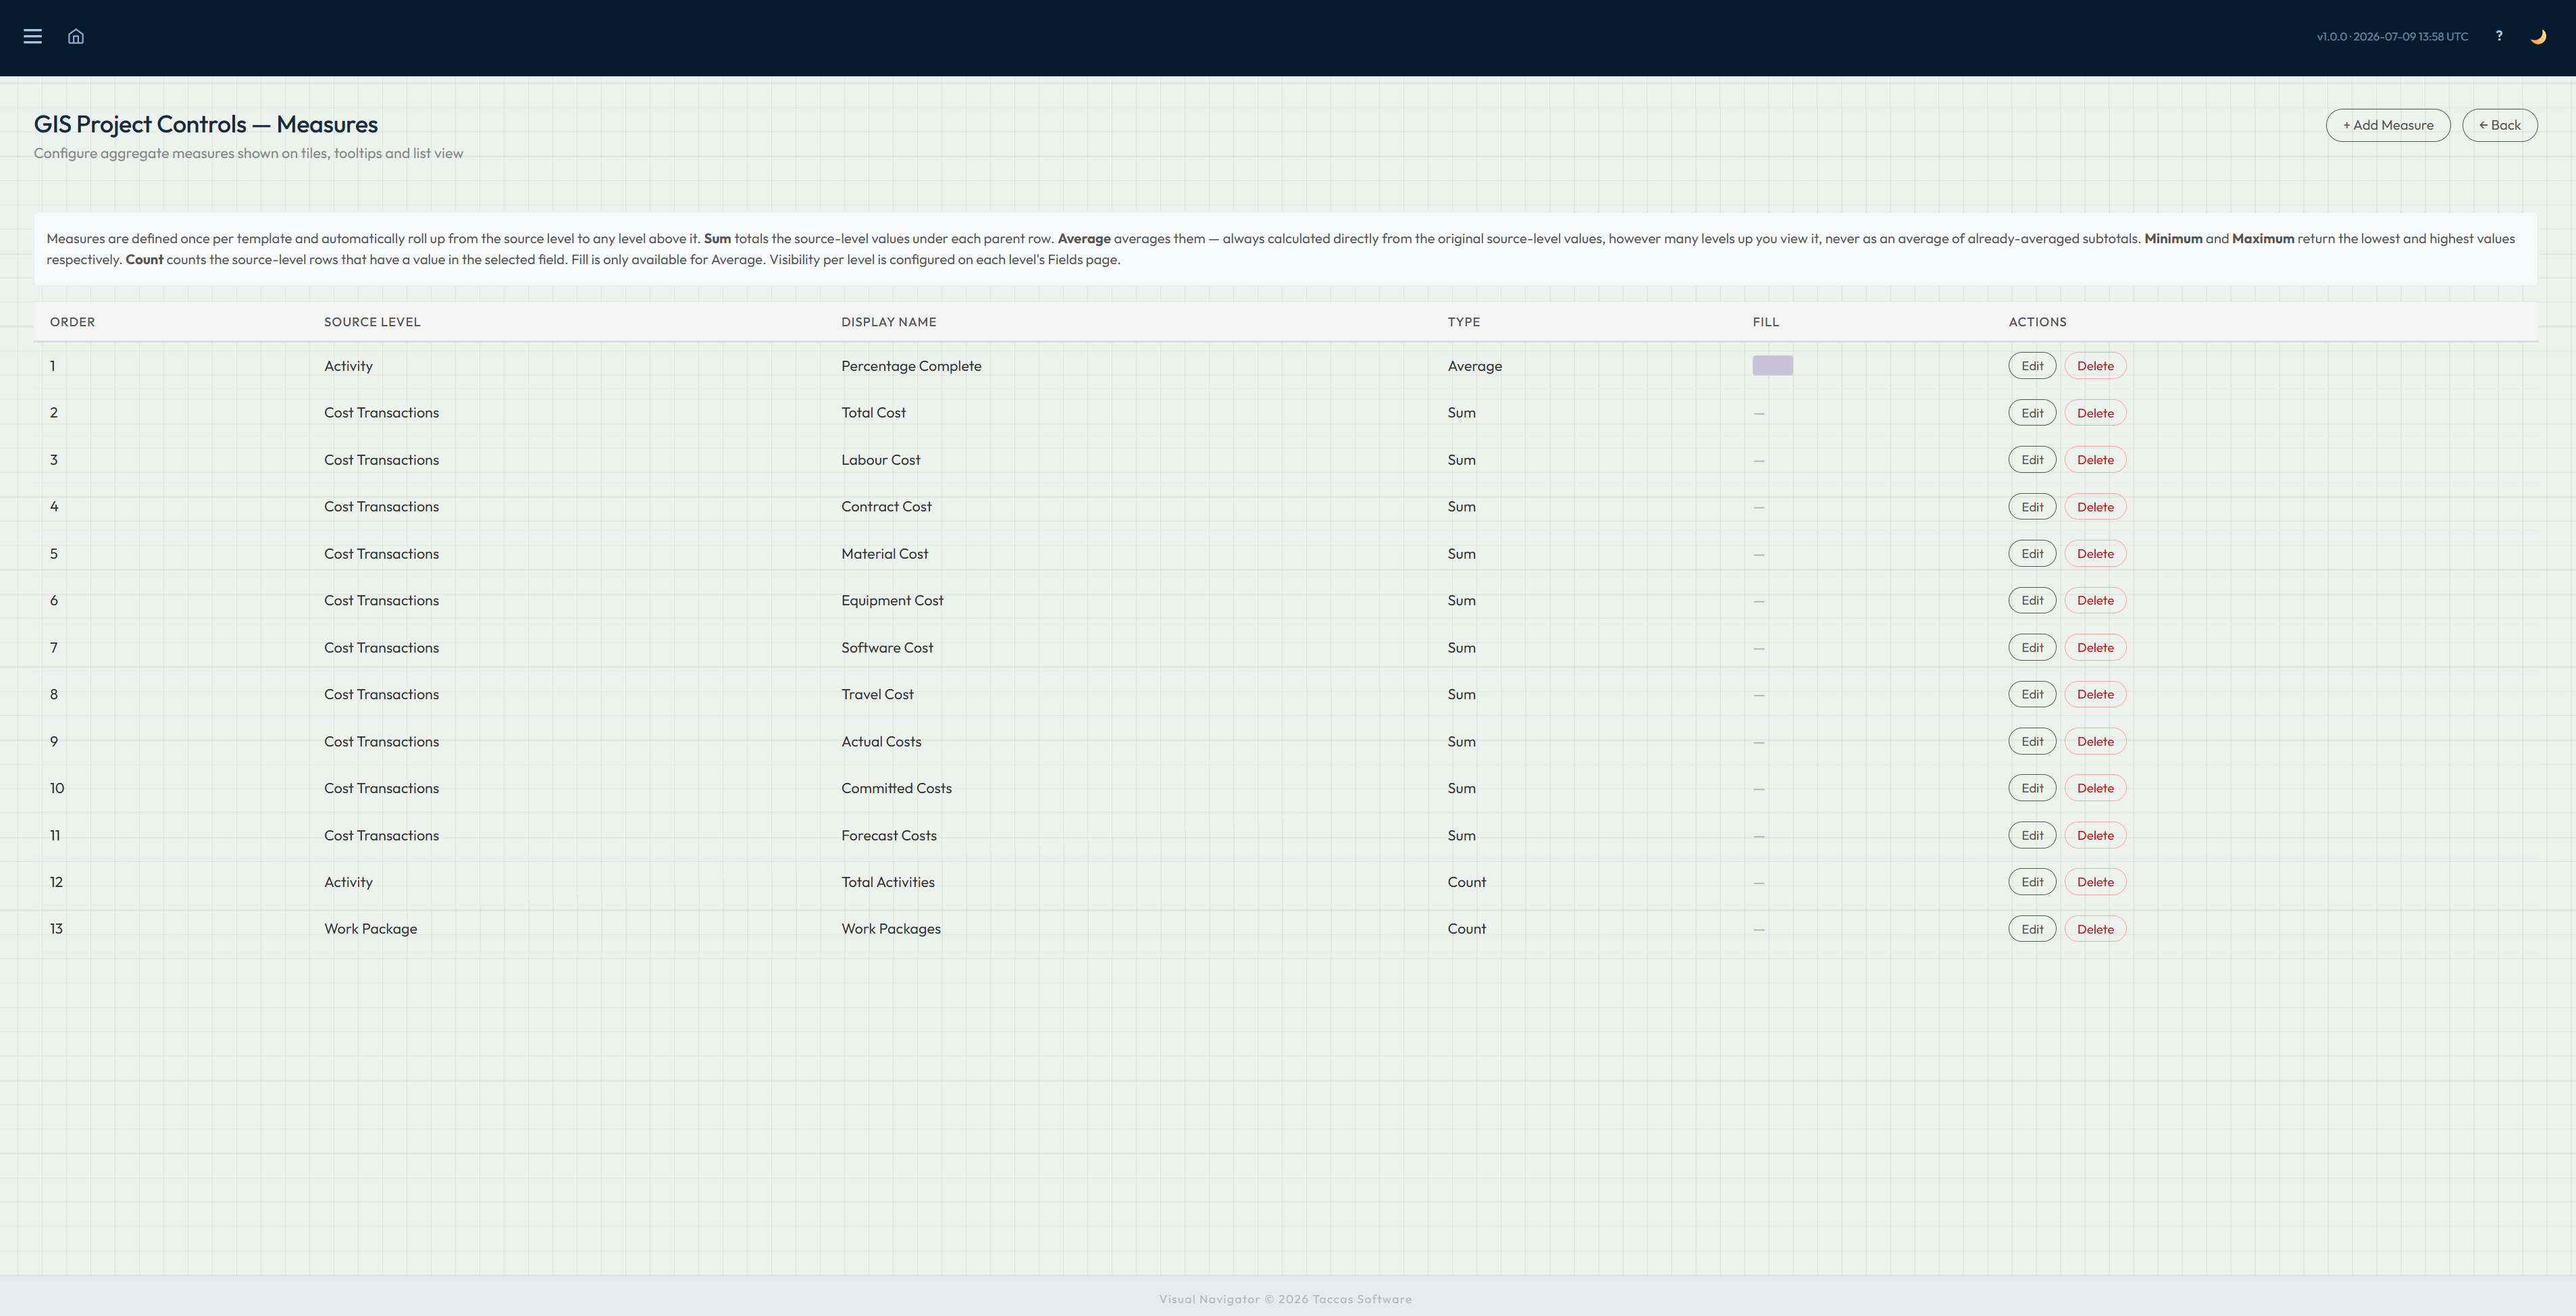
Choose a number recorded at one stage, then decide how Navi should bring it together. It can show a sum, average, count, lowest value or highest value at the stages above, while keeping the underlying records available for people who need the detail.
This can provide a total cost across transactions, an average result across inspections, the number of open cases in a region or another summary that matches your data. Measures can also use the computed and conditional values created in Navi.
Filters
Let each person narrow the dashboard to the work they need.
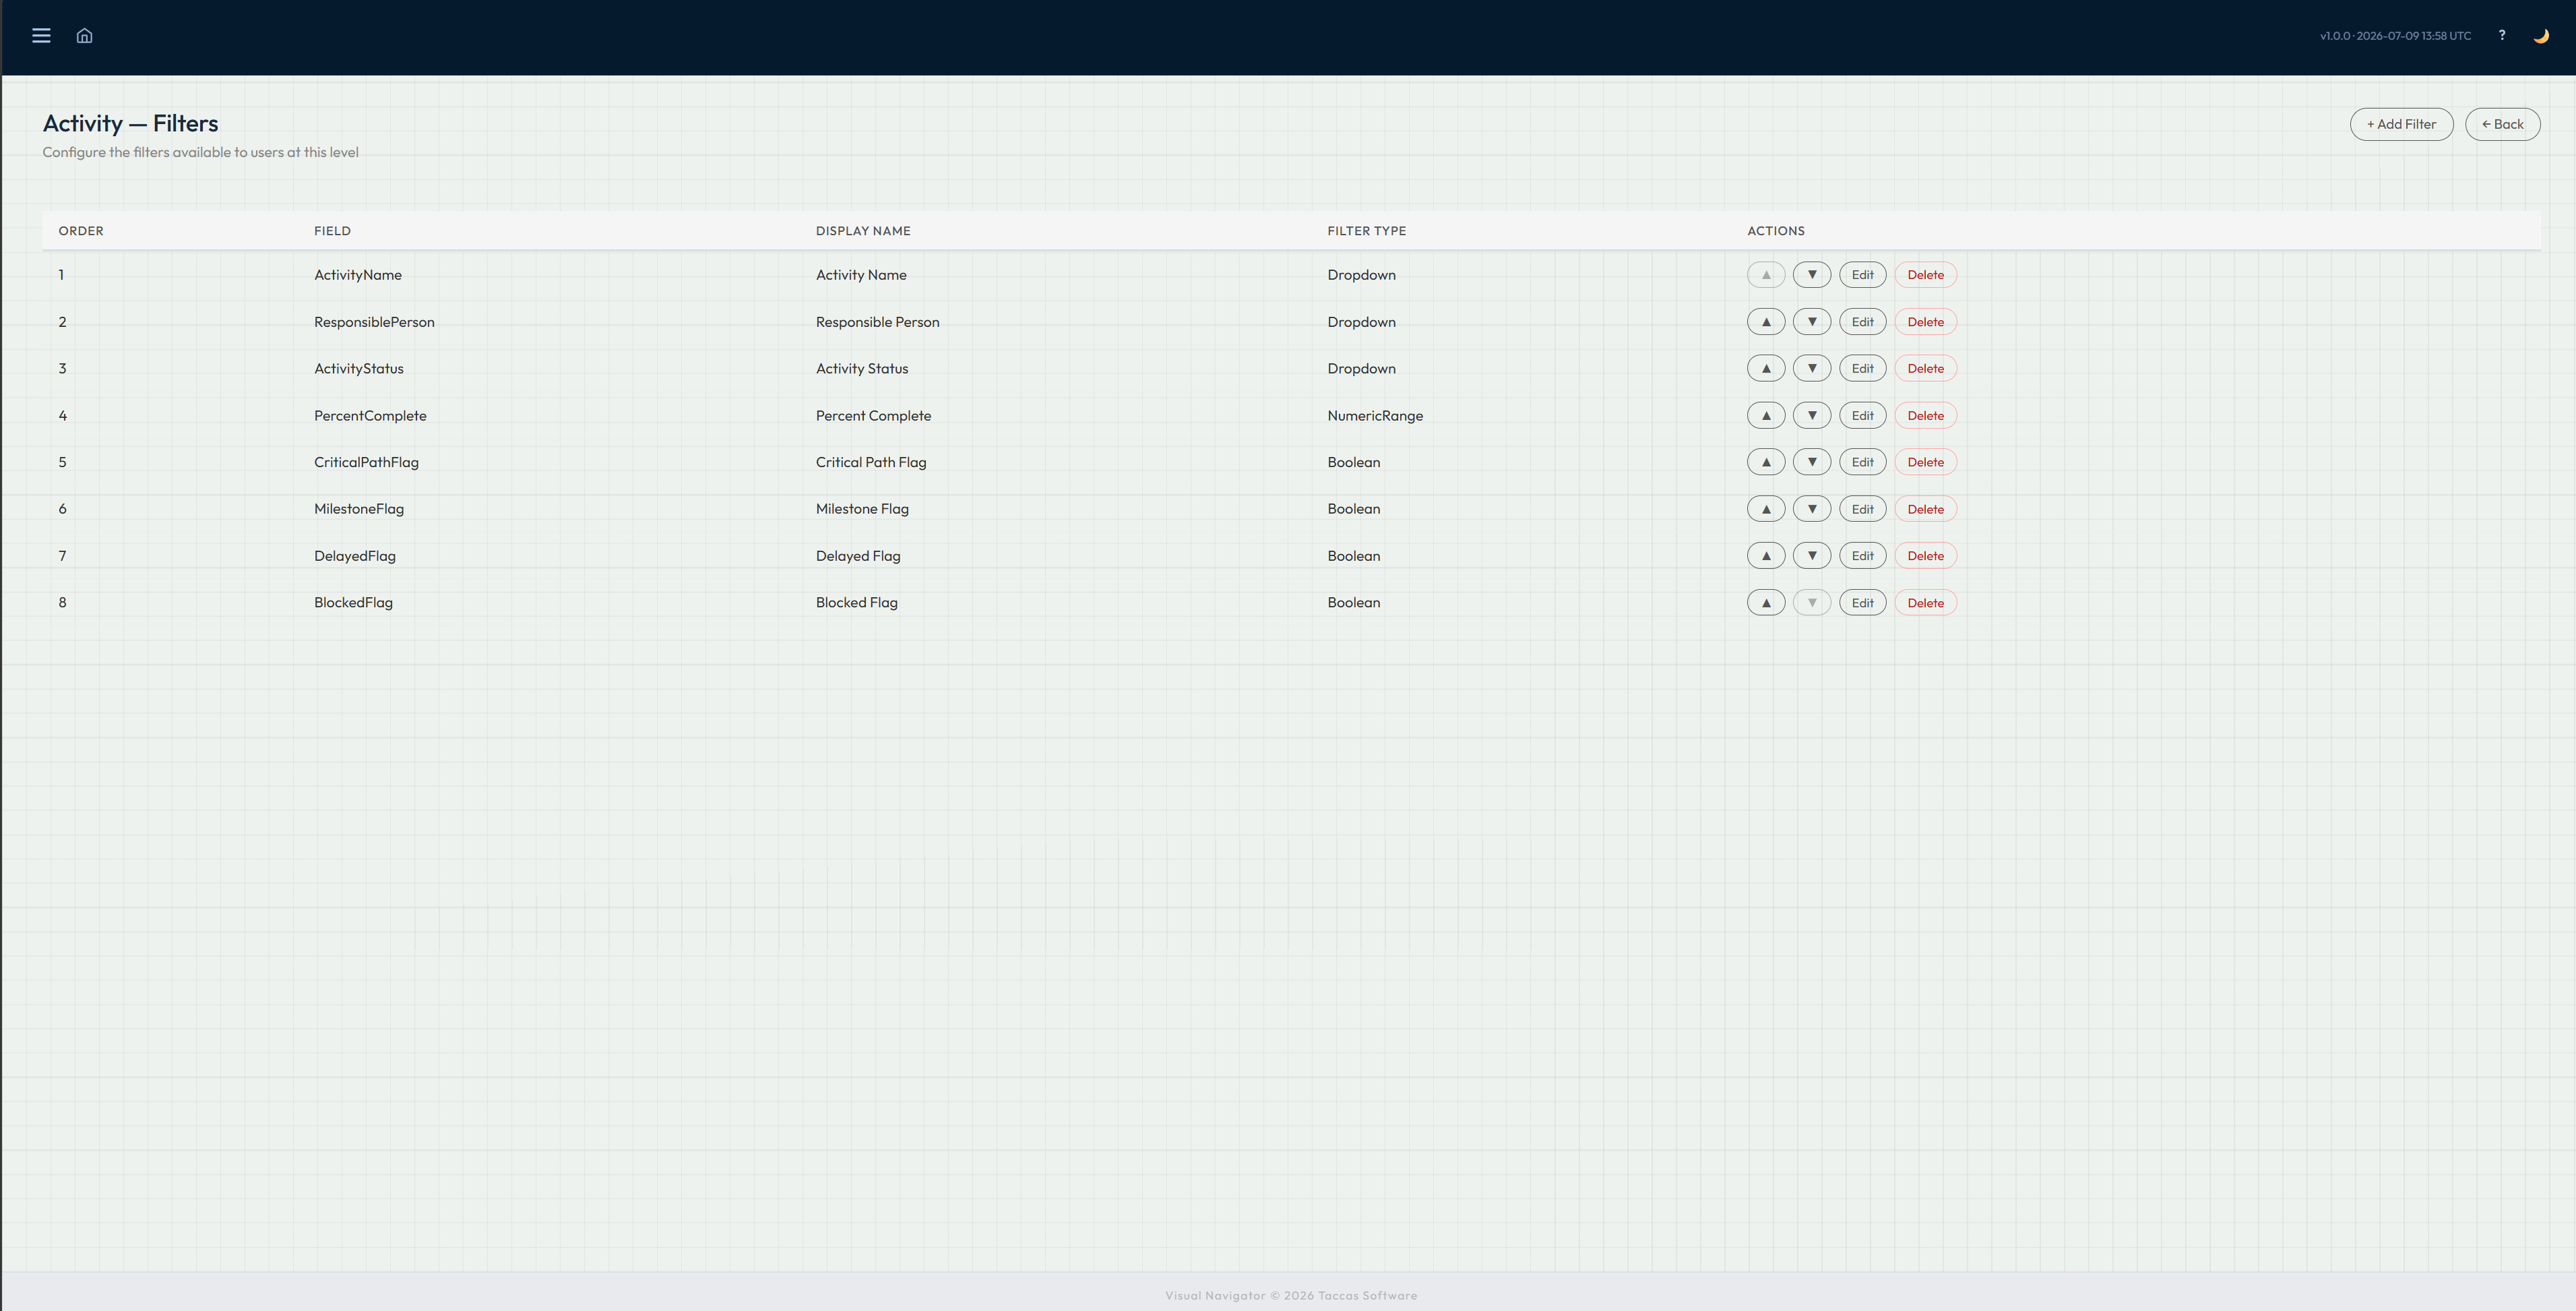
Choose the information people can filter by, give each choice a familiar name and decide how it should work. A list suits names and categories, a range suits dates and numbers, and a simple yes-or-no choice suits fields with two possible states.
Filters can use any suitable fields at that stage of your dashboard, such as location, owner, date, status, value or category. You control their order, and Navi can remember a person's selections so a useful working view is ready when they return.
Turn your information into a working view.
Try Navi with your own Excel or database data.