How it works
Turn business information into something people can follow.
These five stages show what someone does in Navi, why it matters and what the finished result looks like.
Step 1
Bring in the information you already have.
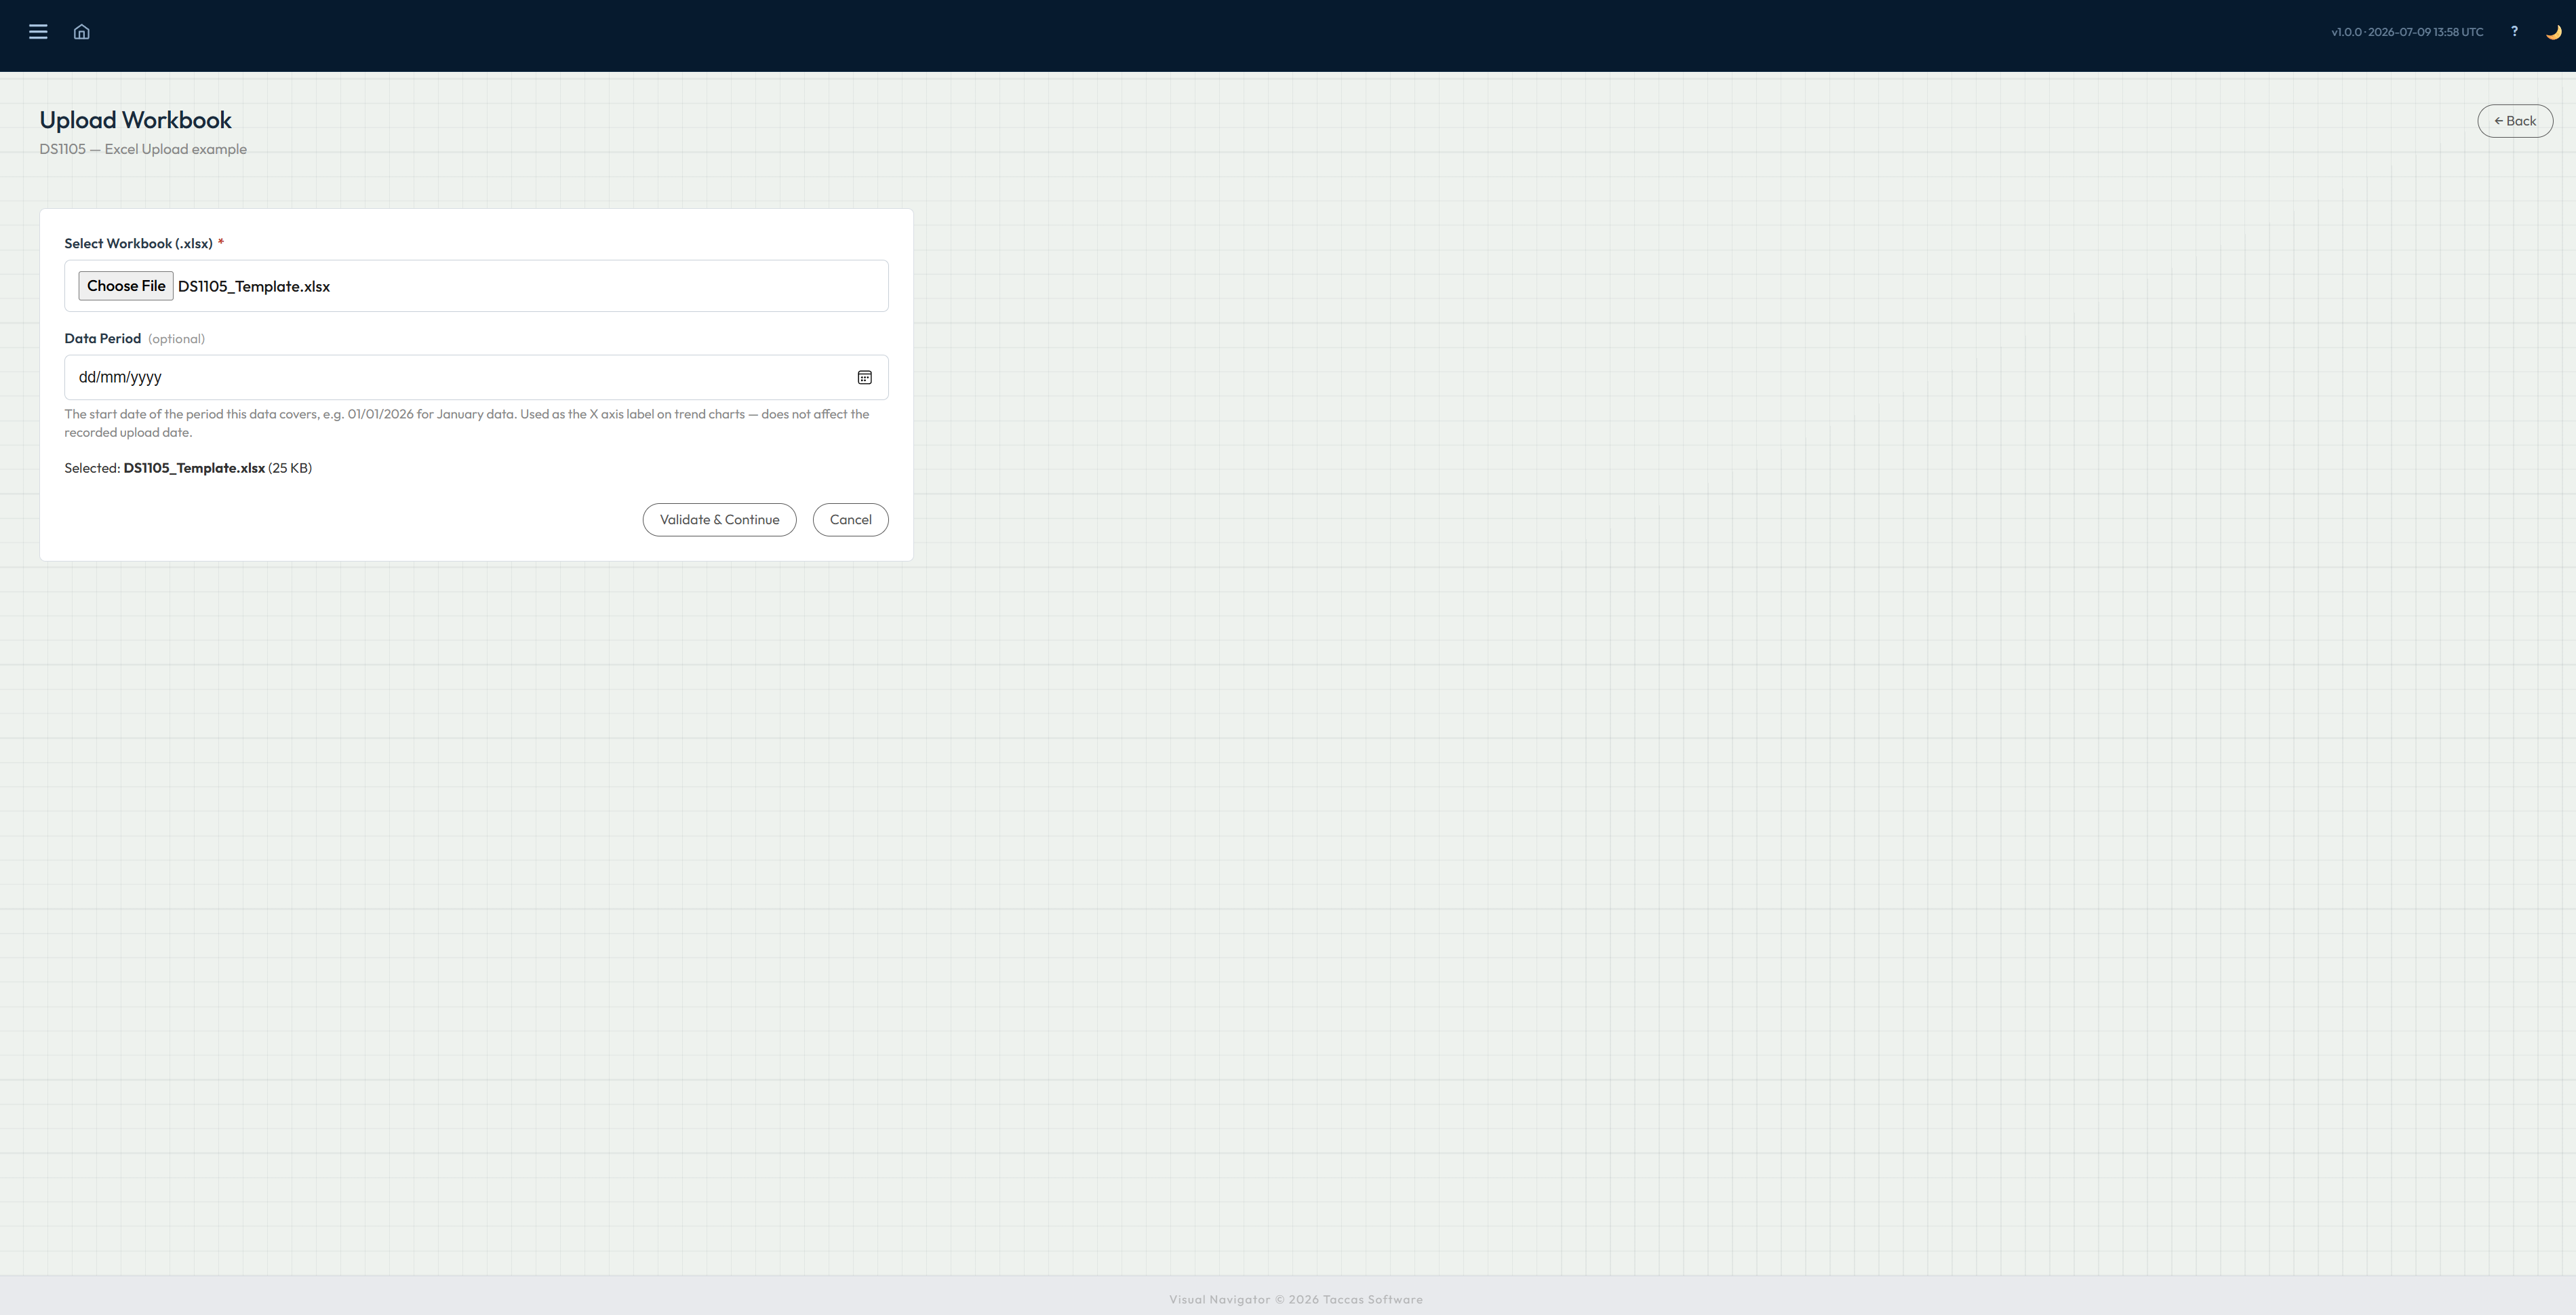
With Excel: create a place for the workbook in Navi, download the workbook Navi prepares, fill it in and upload it. Navi checks the workbook before loading anything and shows problems that need correcting.
With a business database: enter the connection details and test them. Navi reads the information from the database without asking people to copy it into another system first.
This gives the team a controlled starting point and avoids building a dashboard on missing or wrongly understood information.
Step 2
Tell Navi how the information fits together.
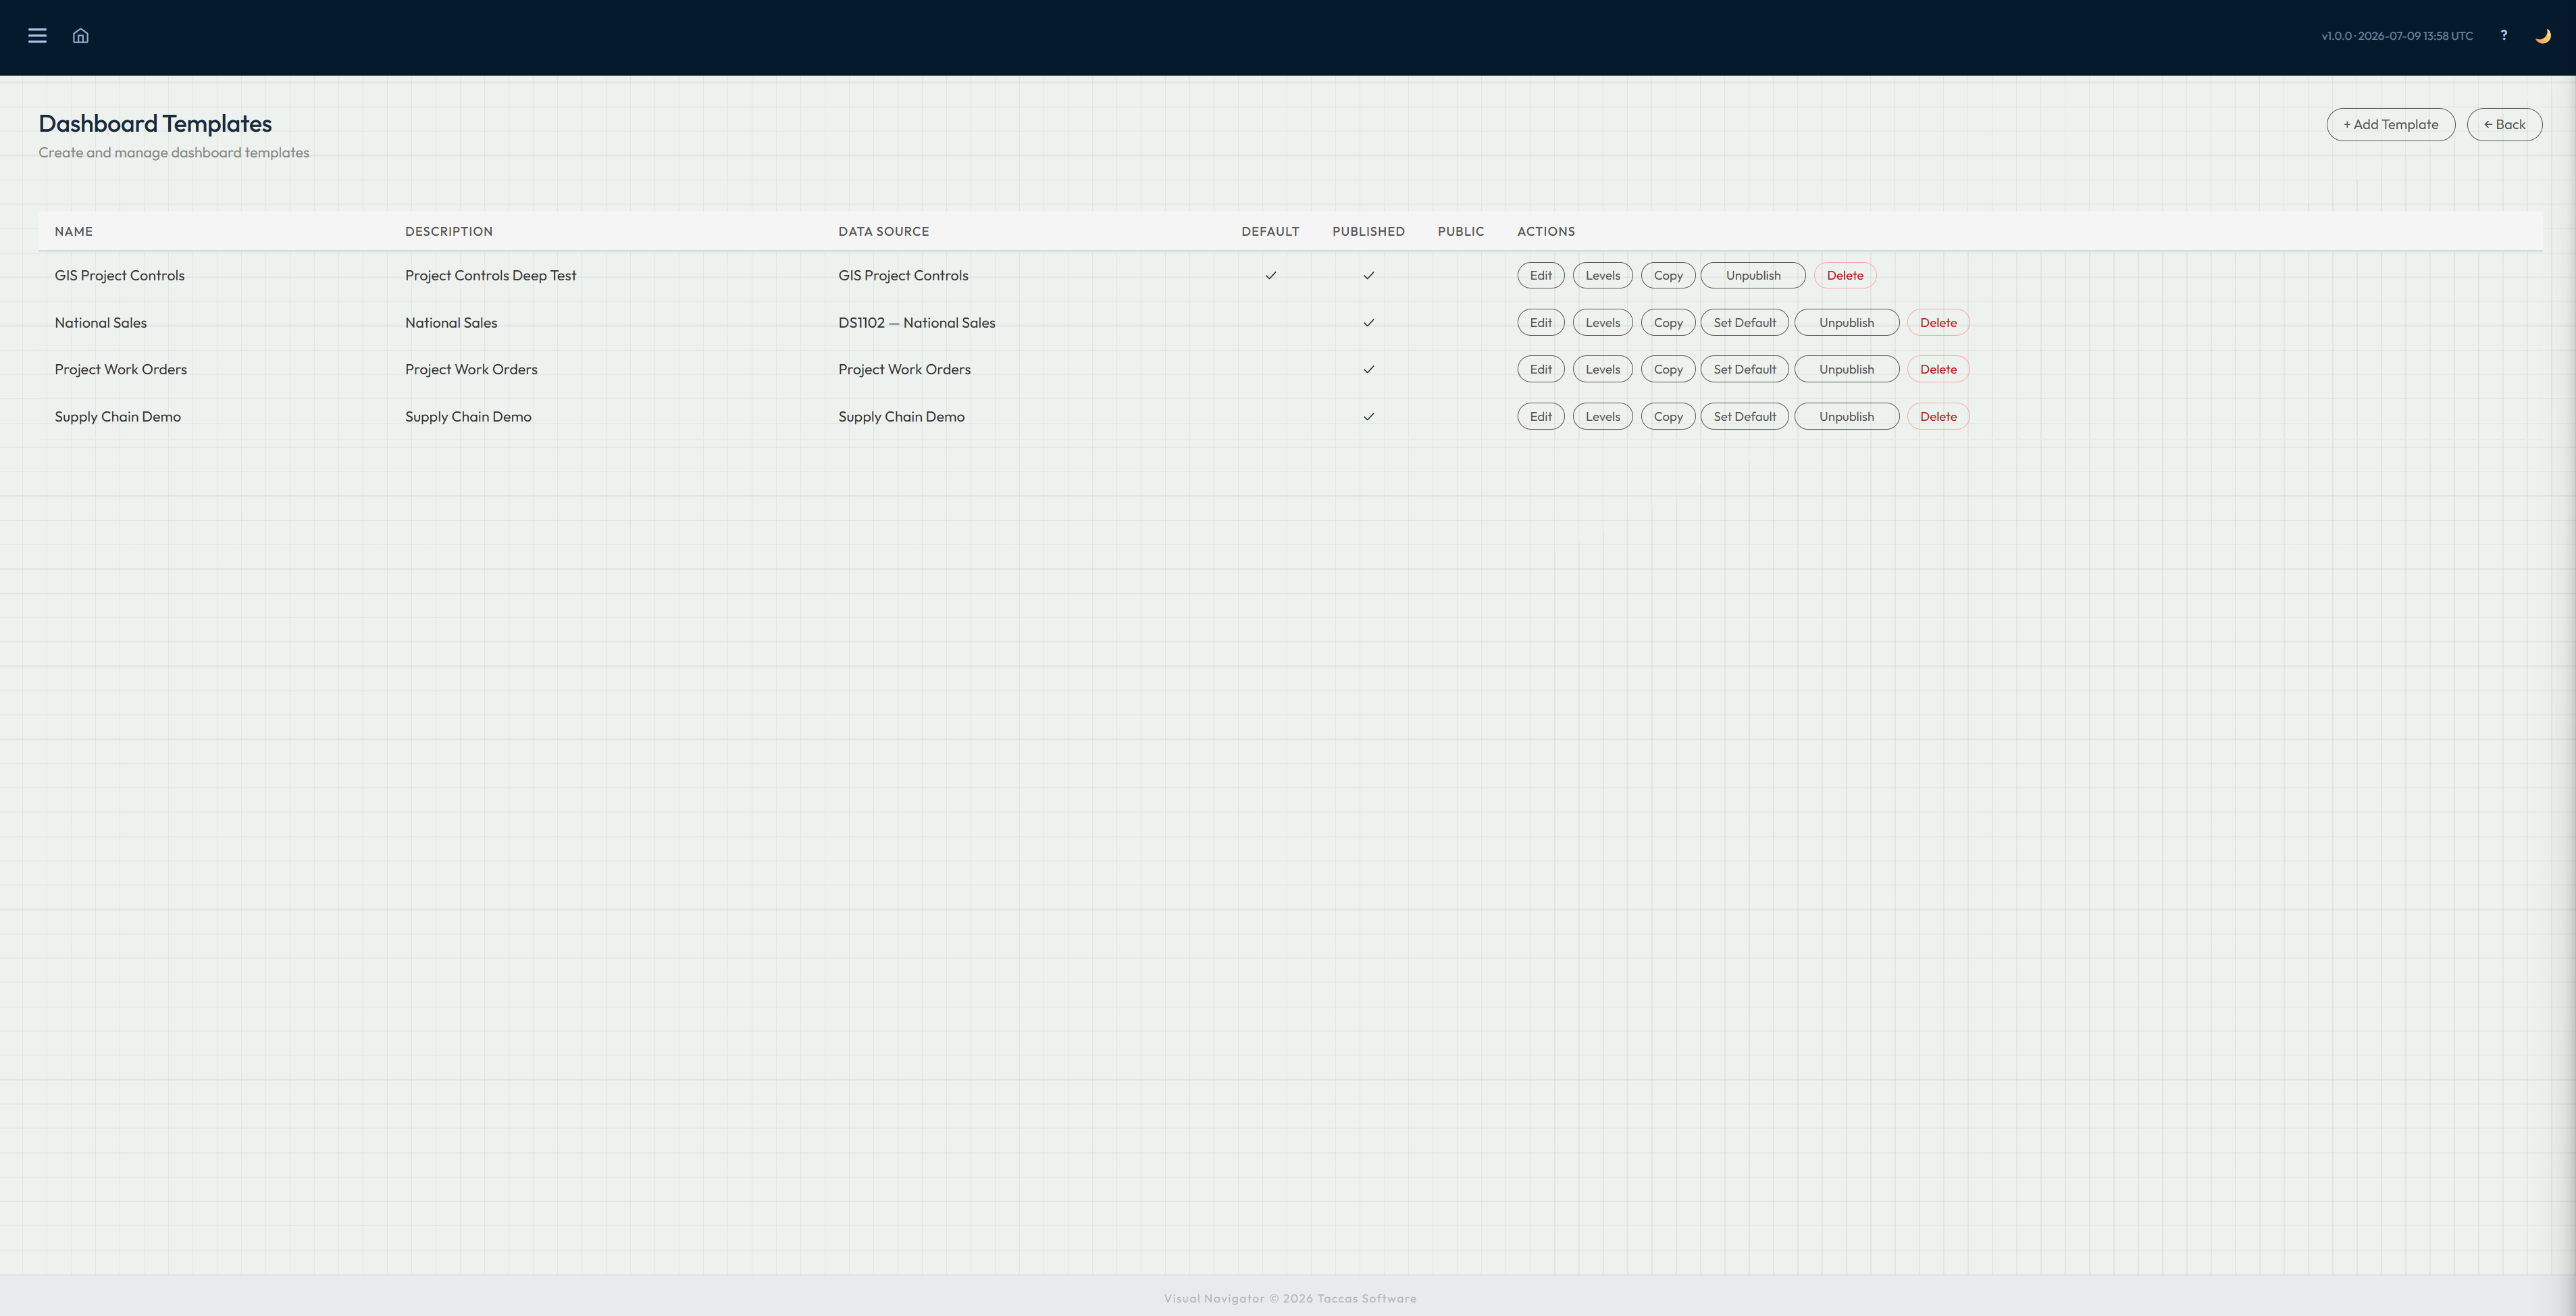
Create the main dashboard and name the stages people will move through. Project work might use portfolio, programme and project. Sales could use region, customer and opportunity. Maintenance could use site, asset and work order.
For each stage, choose which part of the information identifies a record and which part links it to the stage above. This is how Navi knows that a particular project belongs to a programme, or an asset belongs to a site.
The names and stages are not fixed by Navi. They come from the organisation’s own information and way of working.
Step 3
Choose what people see.
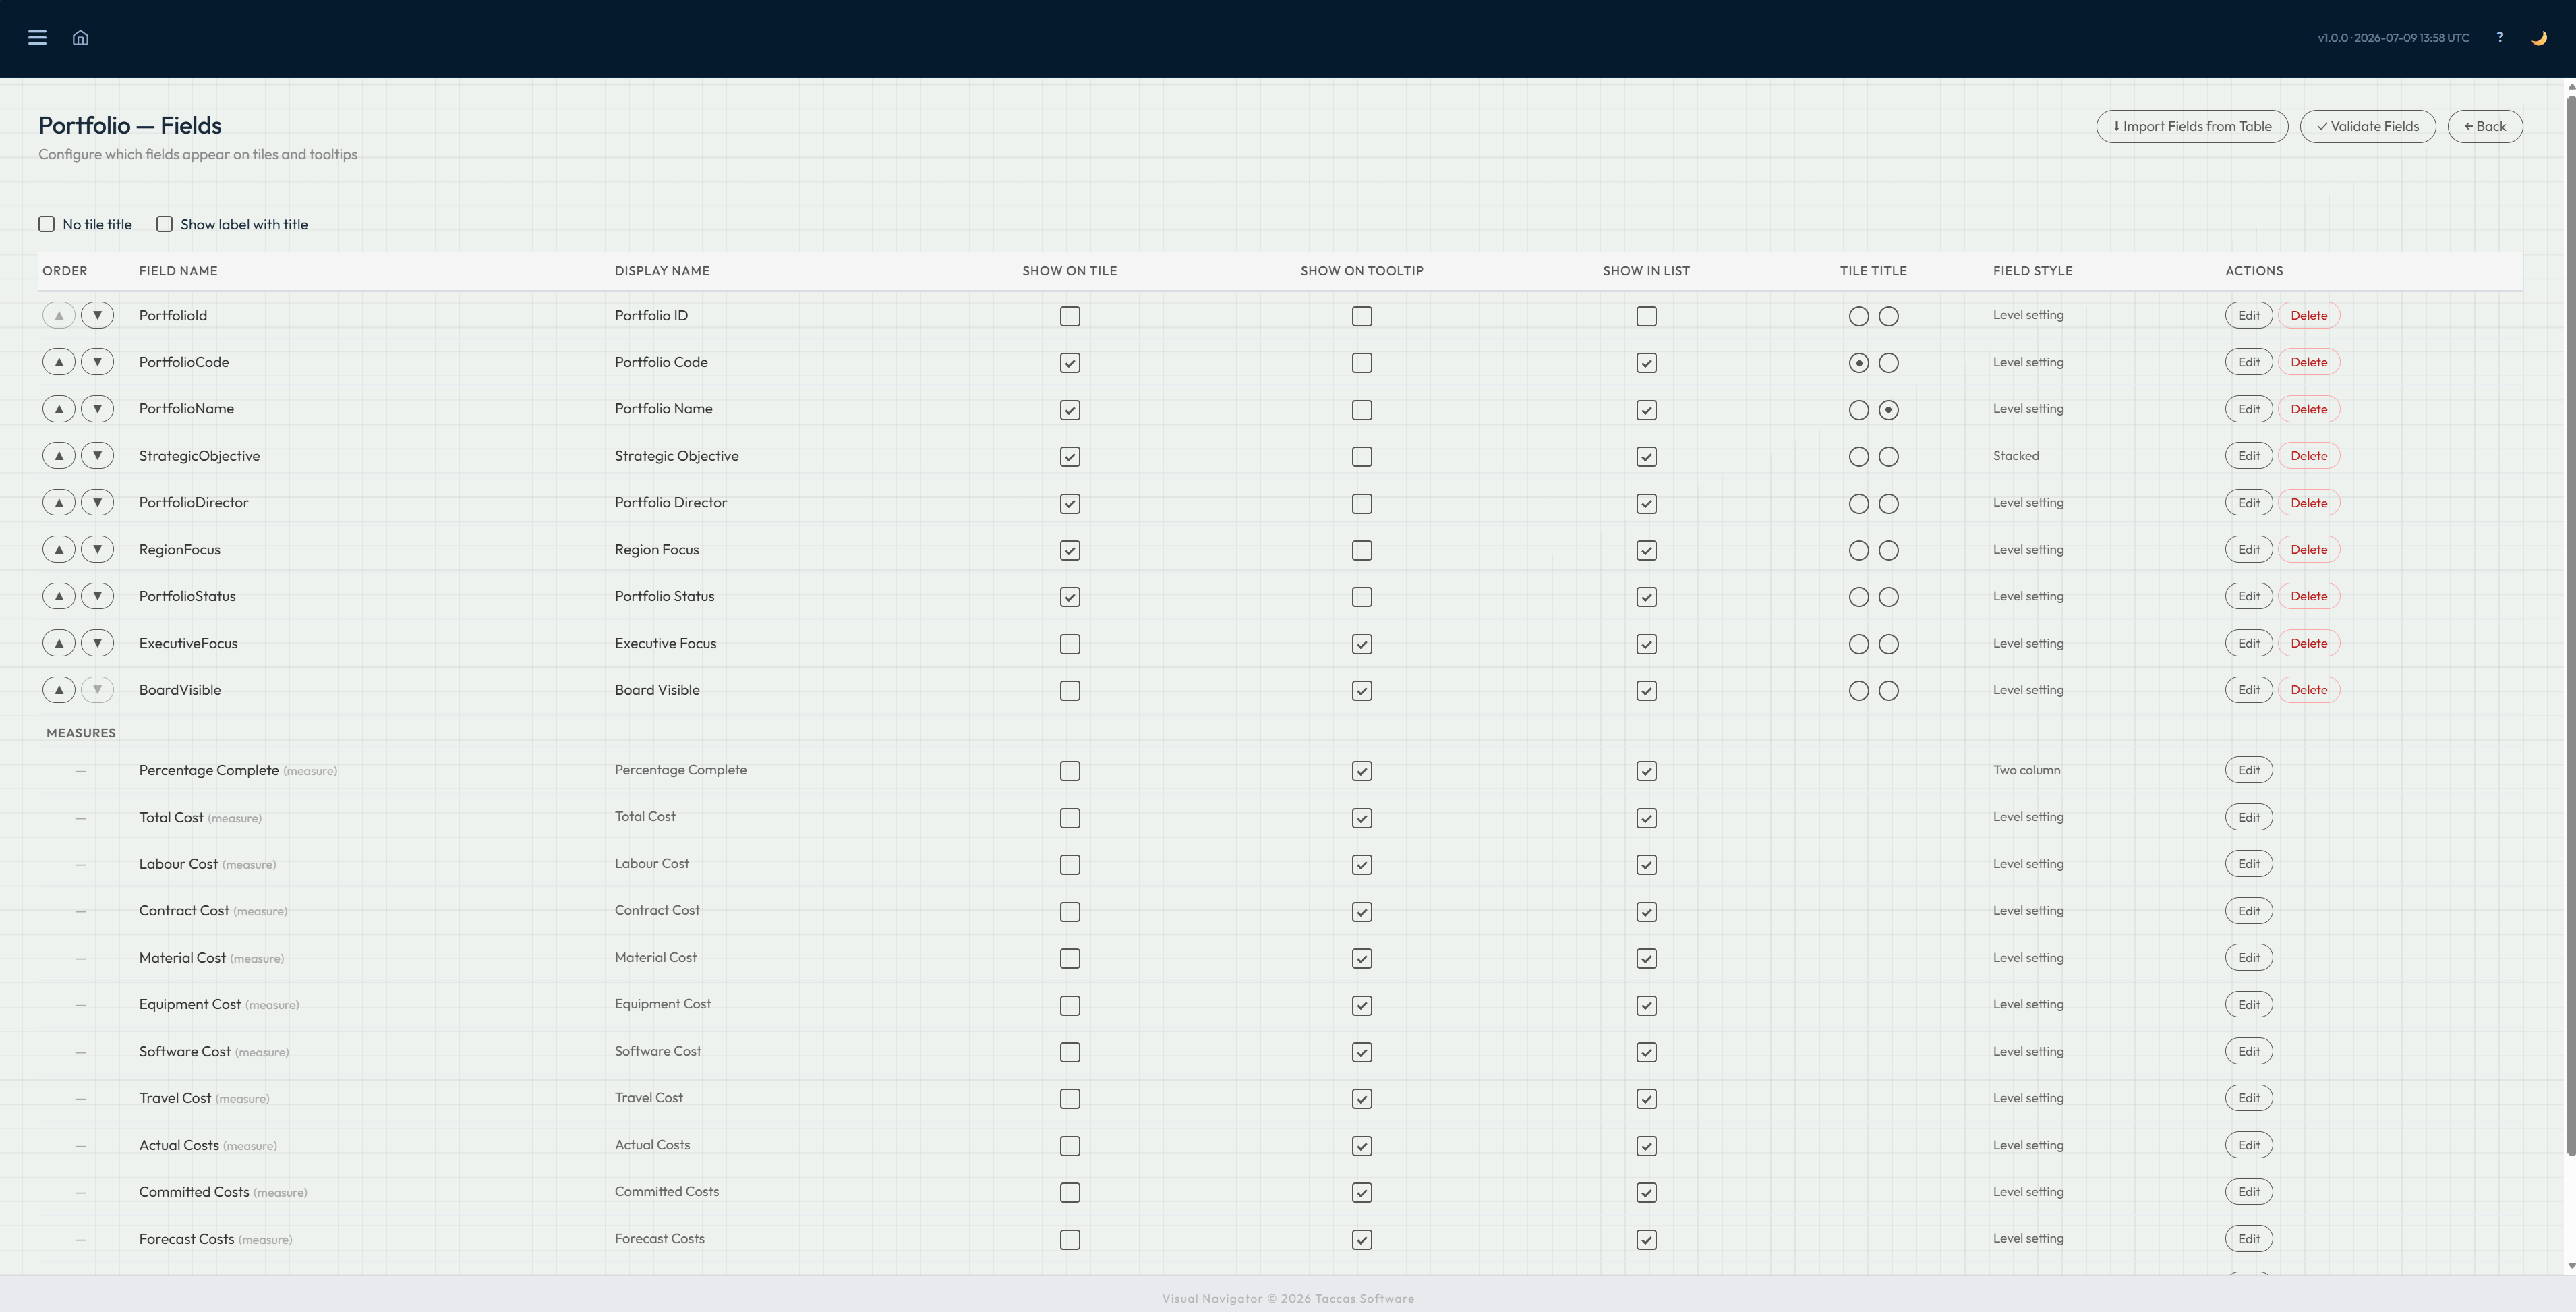
Choose the information that appears on each card, in a table, when someone pauses over a card and on the full record page. Put the most useful facts in the quick view and keep supporting detail available when somebody opens the record.
Choose a clear display name for each item and decide the order in which it appears. The full record page can be arranged into headings and sections so it follows the way people naturally read the information.
This prevents every screen becoming a wall of columns while still keeping the detail available.
Step 4
Add totals, markers and warnings.
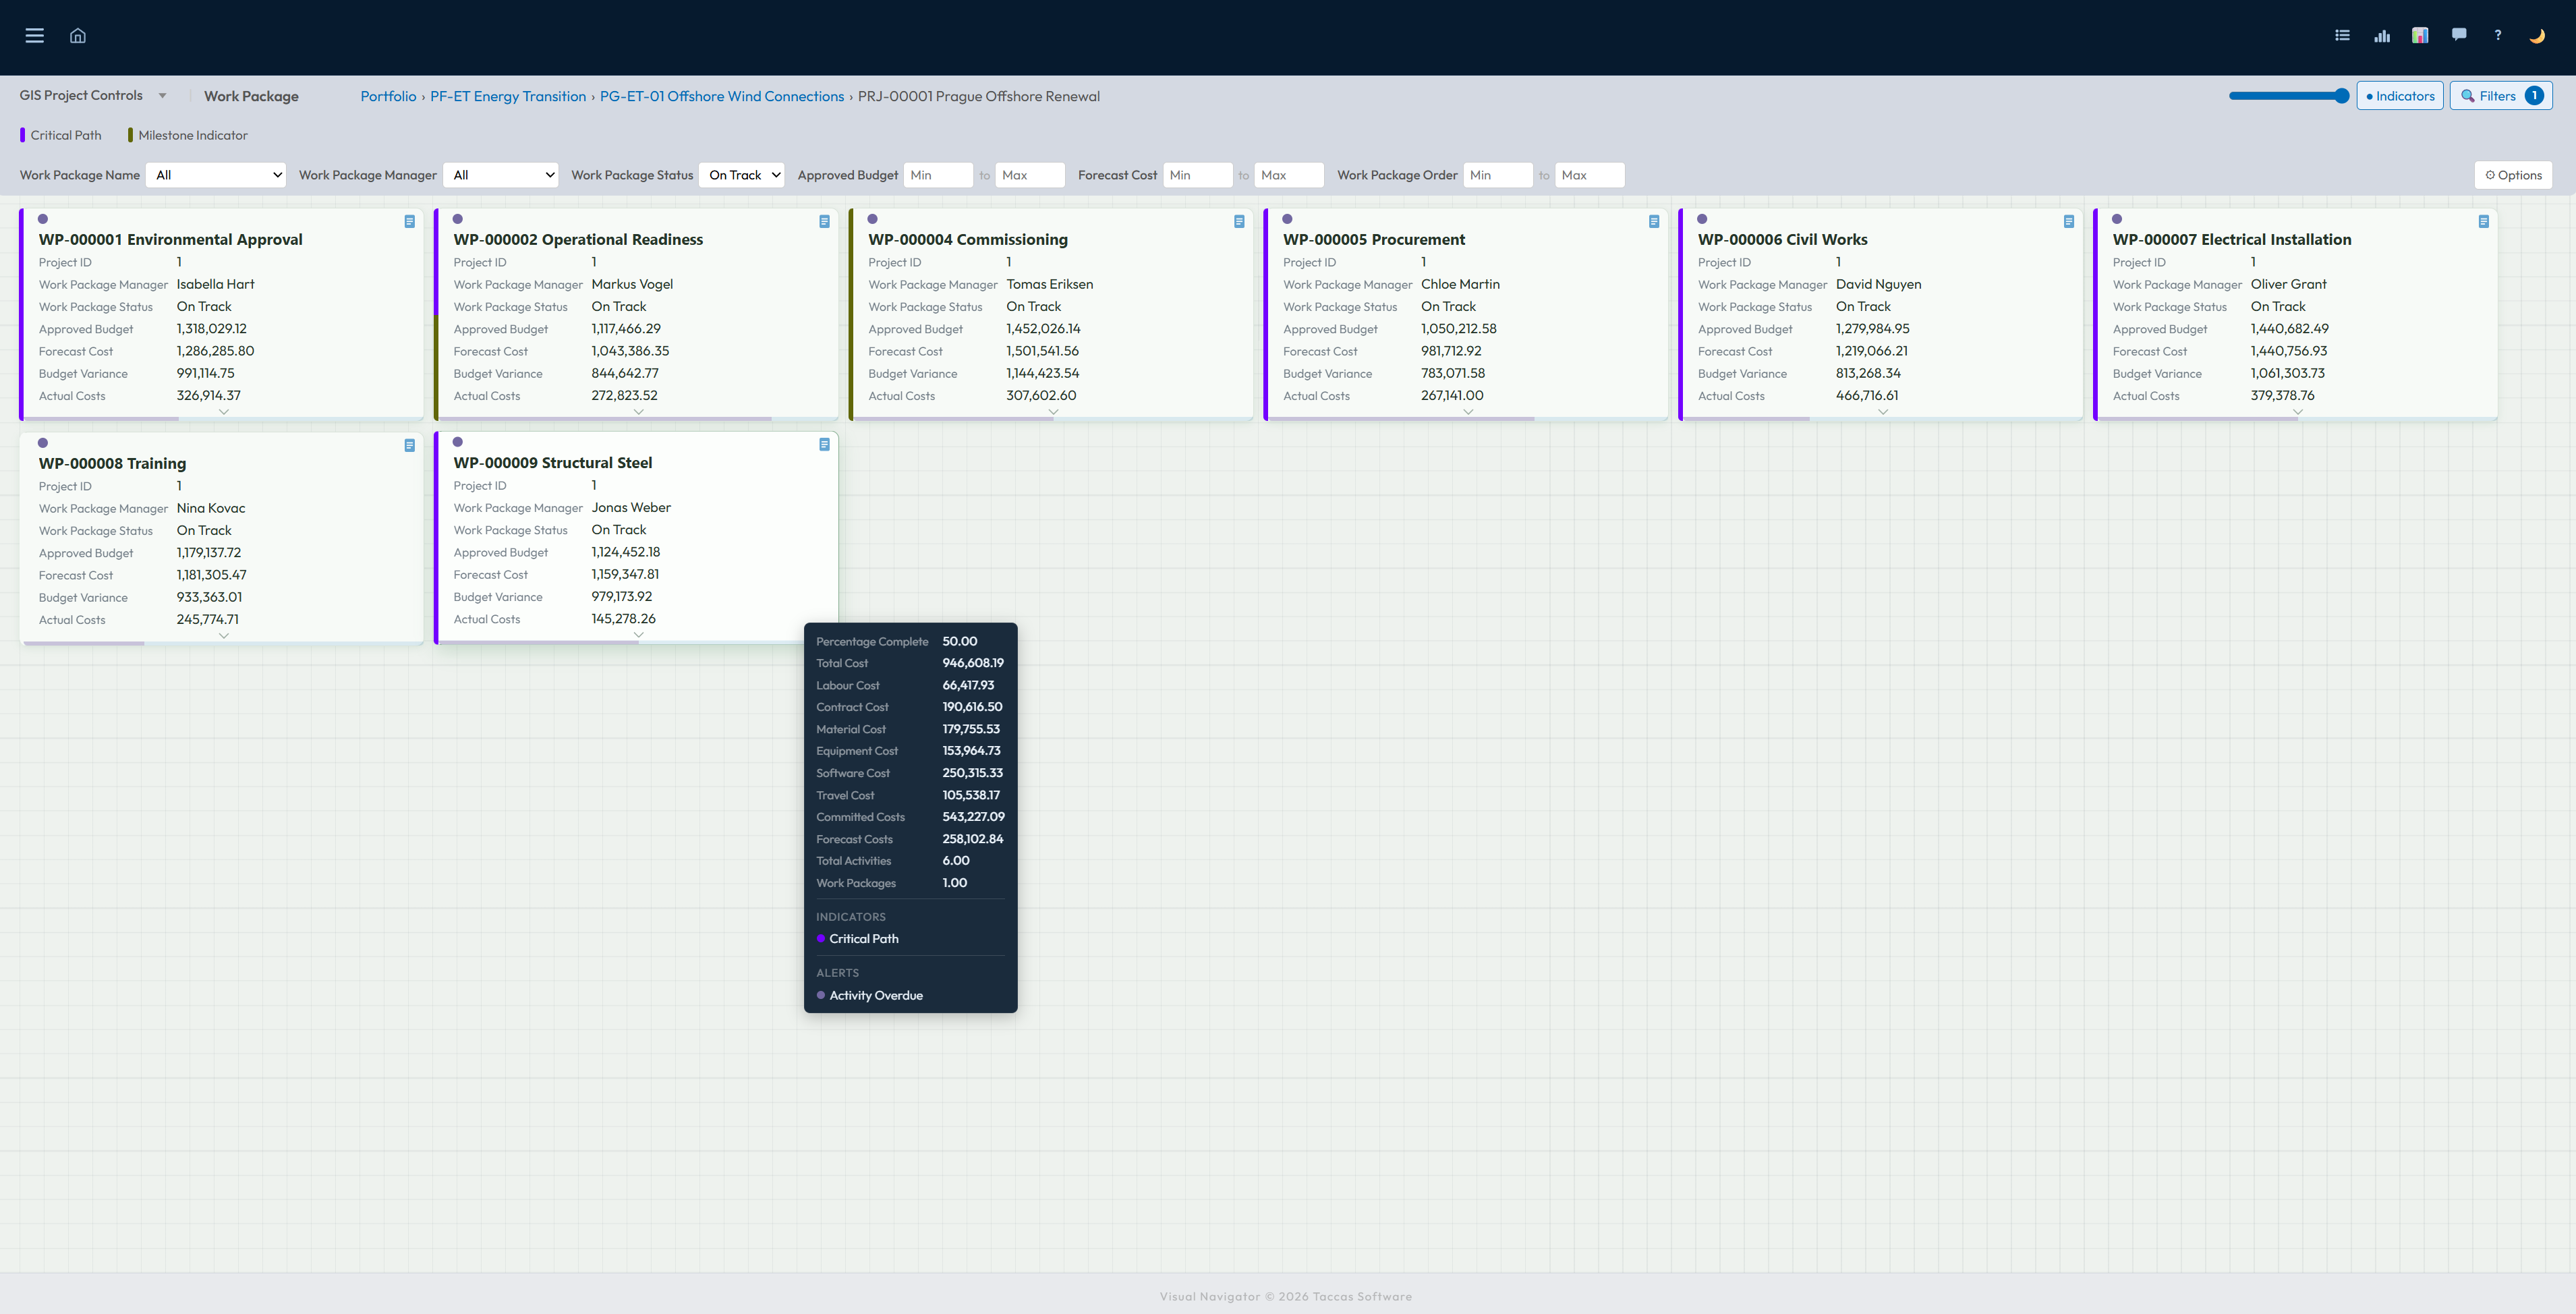
Choose the values people can use to narrow what they see, such as owner, region, date or status. Set simple rules for coloured markers and warnings, including overdue work, costs above a limit or work that is no longer on track.
Navi can also create useful totals and new values from the information already present. A manager can see a total at the top, then open the work below it to understand where that number came from.
These rules turn a collection of records into a working view that helps people decide where to look first.
Step 5
Use the dashboard day to day.
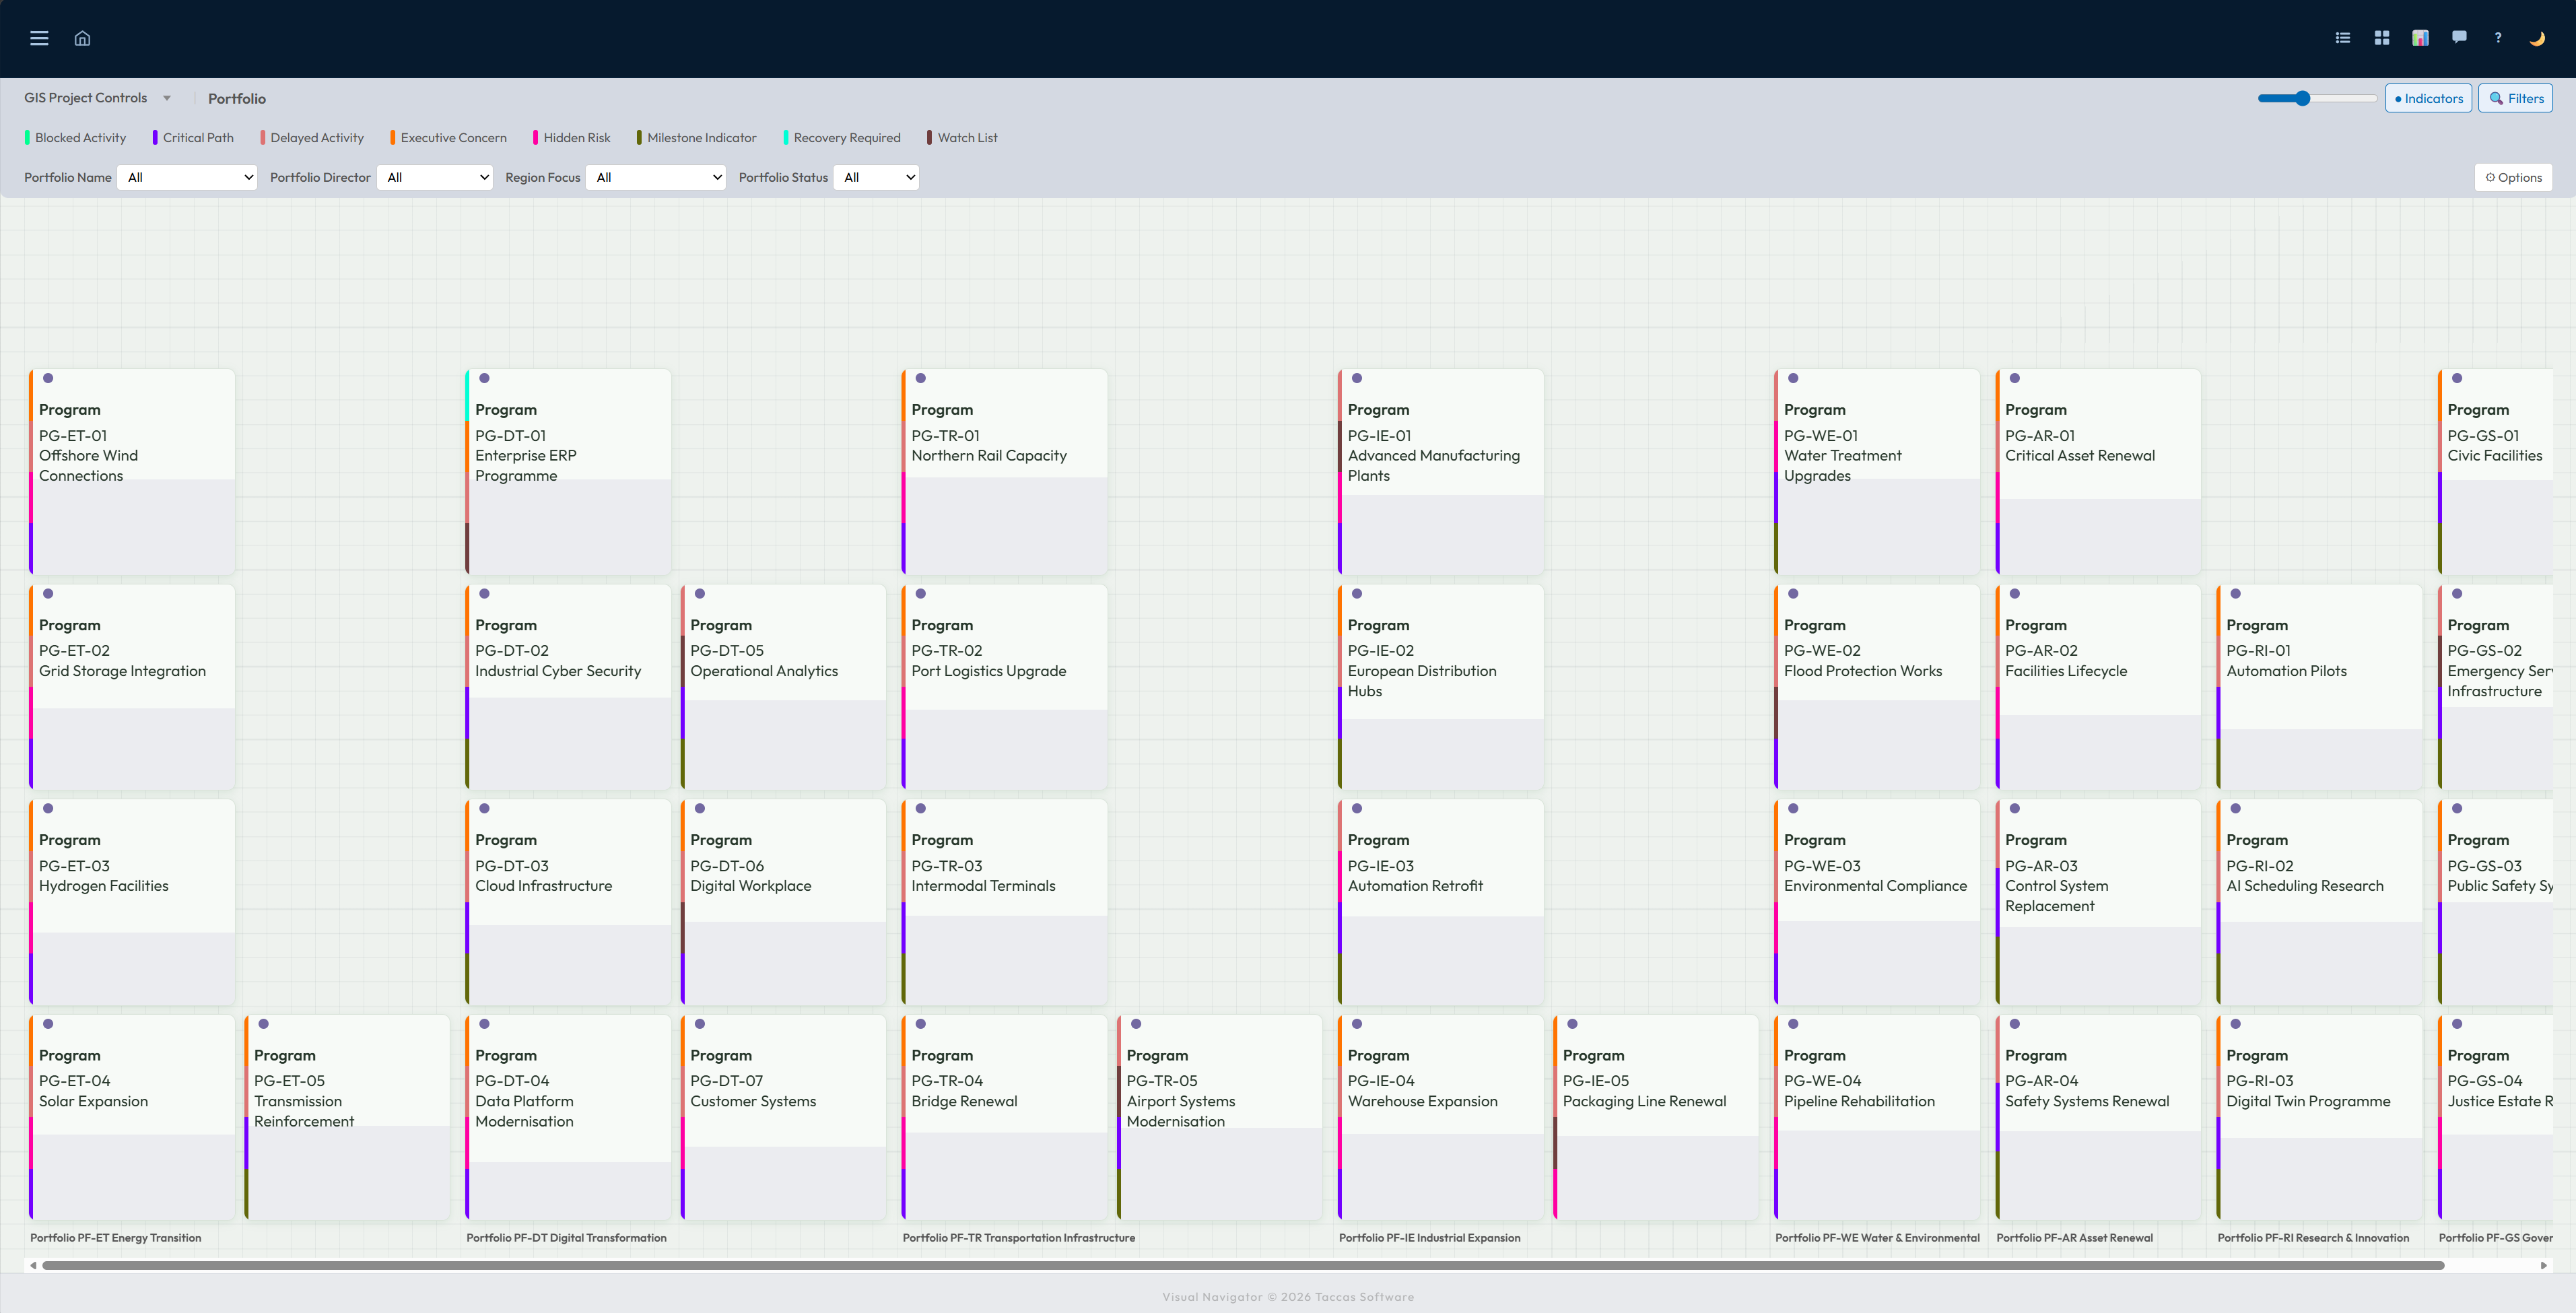
Start with a summary and select a card to open the work behind it. Continue into smaller groups or individual records while Navi keeps the path visible.
Use cards for a quick overview, grouped columns for seeing what belongs together, or a table for comparing many records. Open the full page when more detail is needed, and send table results to Excel when somebody needs to work with them elsewhere.
Important markers and warnings remain visible as people move around, so the dashboard is useful for daily work rather than being a report people only glance at.
See the full process with your own information.
The 30-day trial includes the dashboard, design and analysis features described above.