History
See what changed, not only what is true today.
Navi builds a history from dated Excel uploads and scheduled copies of database information. People can then compare periods, follow a value on a graph and find patterns across many records.
Two ways to keep history
Excel uploads and database snapshots both preserve earlier information.
Excel history is created from dated workbook uploads. Database history is created by taking scheduled or immediate snapshots. Trend Graph and Data Matrices use this saved information, but they are reports and are explained in the Reports section.
Excel history
Keep each dated workbook load.
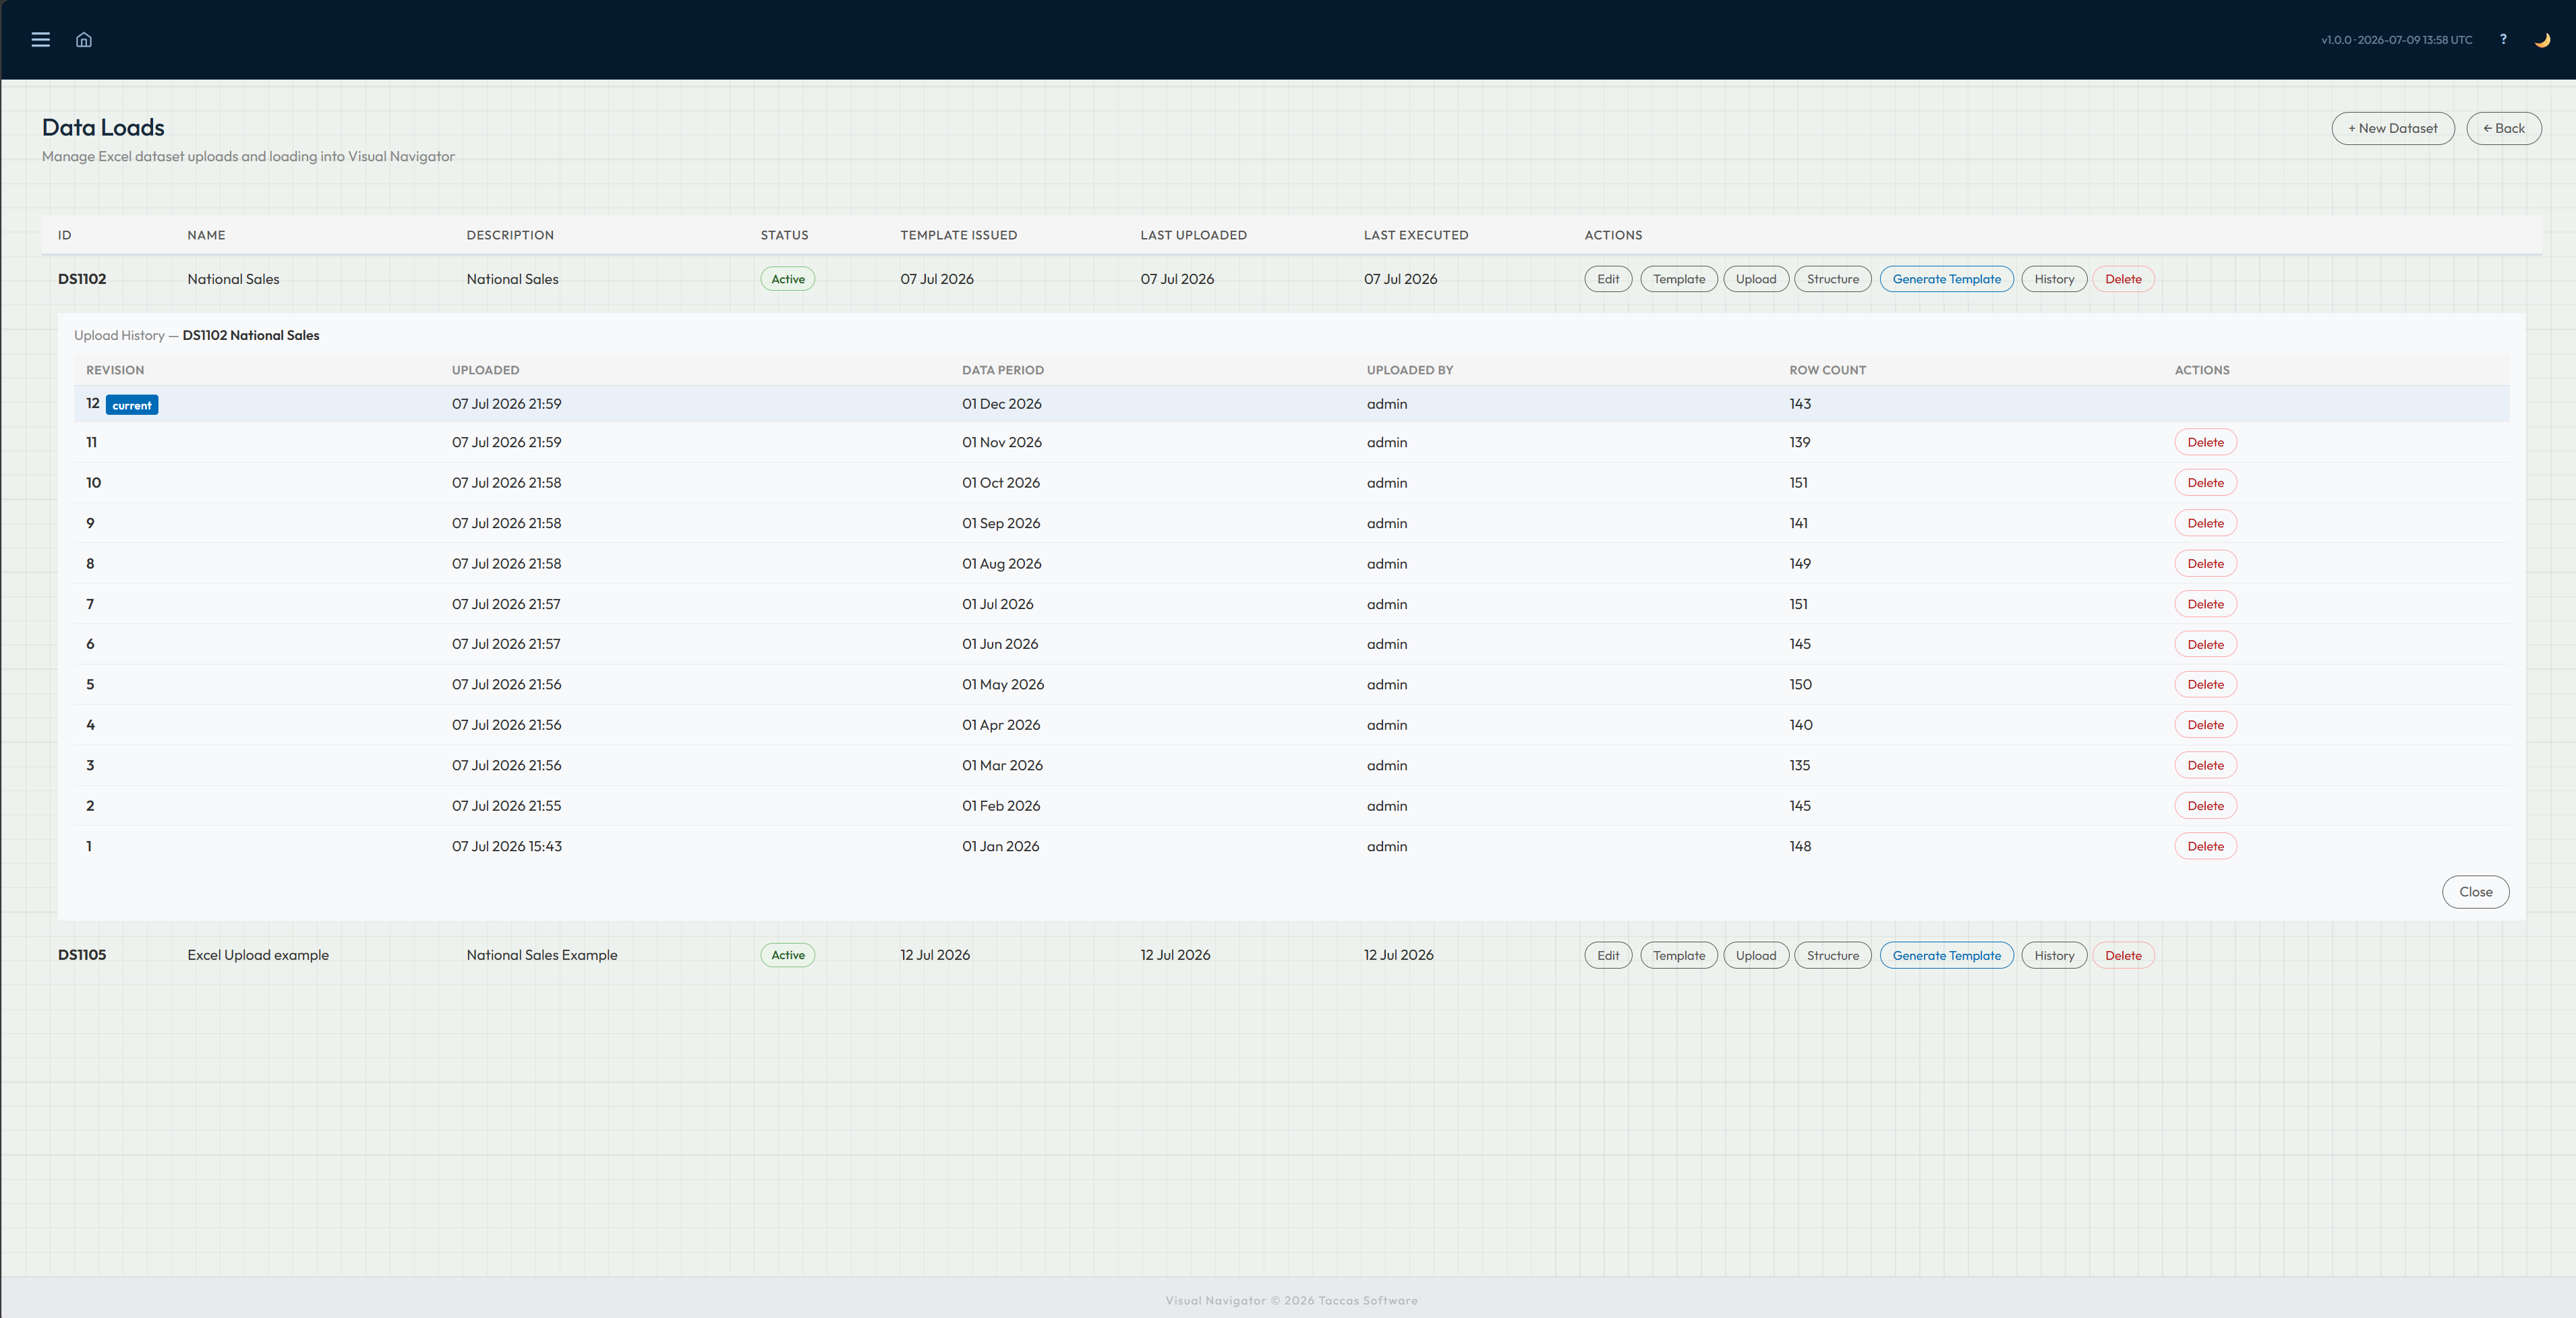
Open the history for an Excel dataset to see every workbook revision, when it was uploaded, the period the information covers, who uploaded it and how many records it contained.
Each new workbook adds another point in time instead of replacing the previous loads. Navi identifies the current revision while keeping earlier periods available, so people can return to the information that was supplied at any recorded date.
Database snapshots
Decide what Navi should keep and how often.
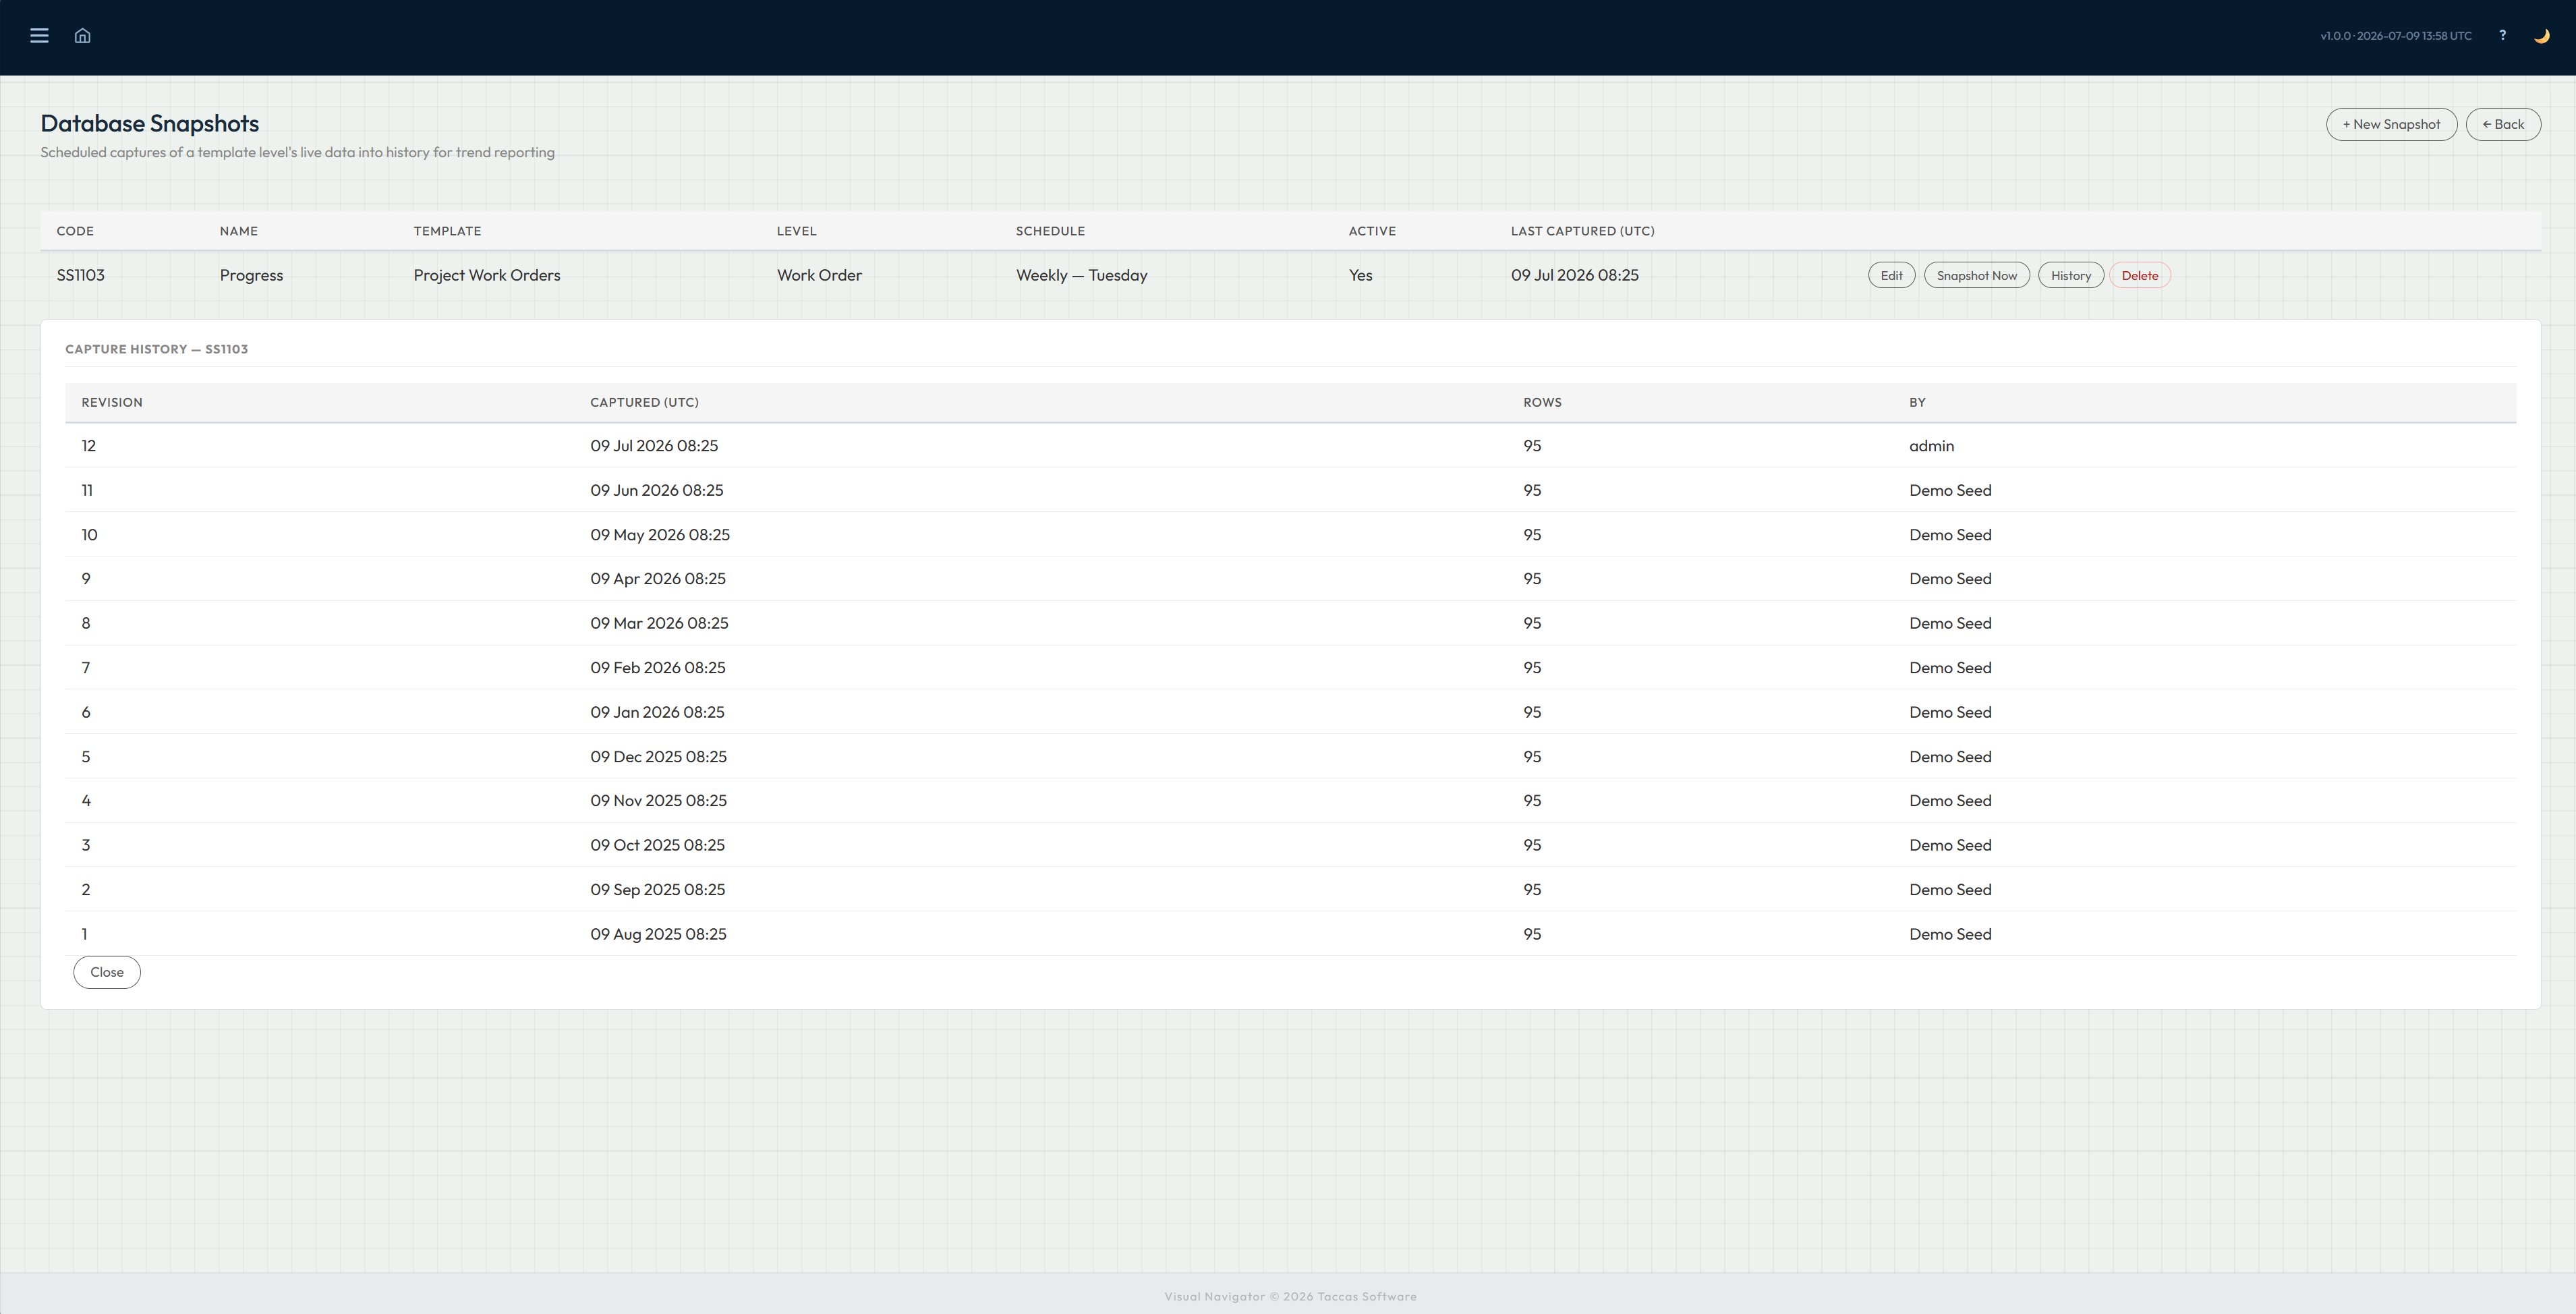
Create a snapshot for the dashboard and part of the business you want to follow. Give it a clear name, choose how often it should run and make it active. An authorised user can also take a copy immediately.
Open the snapshot history to see every saved revision, when it was captured, how many records it contains and who created it. This makes the scheduled history visible and confirms that each expected period was captured successfully.